
Chapter Leads: Amy Olex, Andrea Zhou
8.1 Introduction
This chapter introduces tools in the N3C Data Enclave used to analyze data, view results, track project progress, and obtain shared data and code developed in the N3C community. The focus is on accessing and using each tool, the skill level needed, as well as what types of analyses each tool is geared toward. It is expected that you know how data are organized in the Enclave, including the OMOP data model, vocabulary, and concept sets (see Chapter 7 for details).
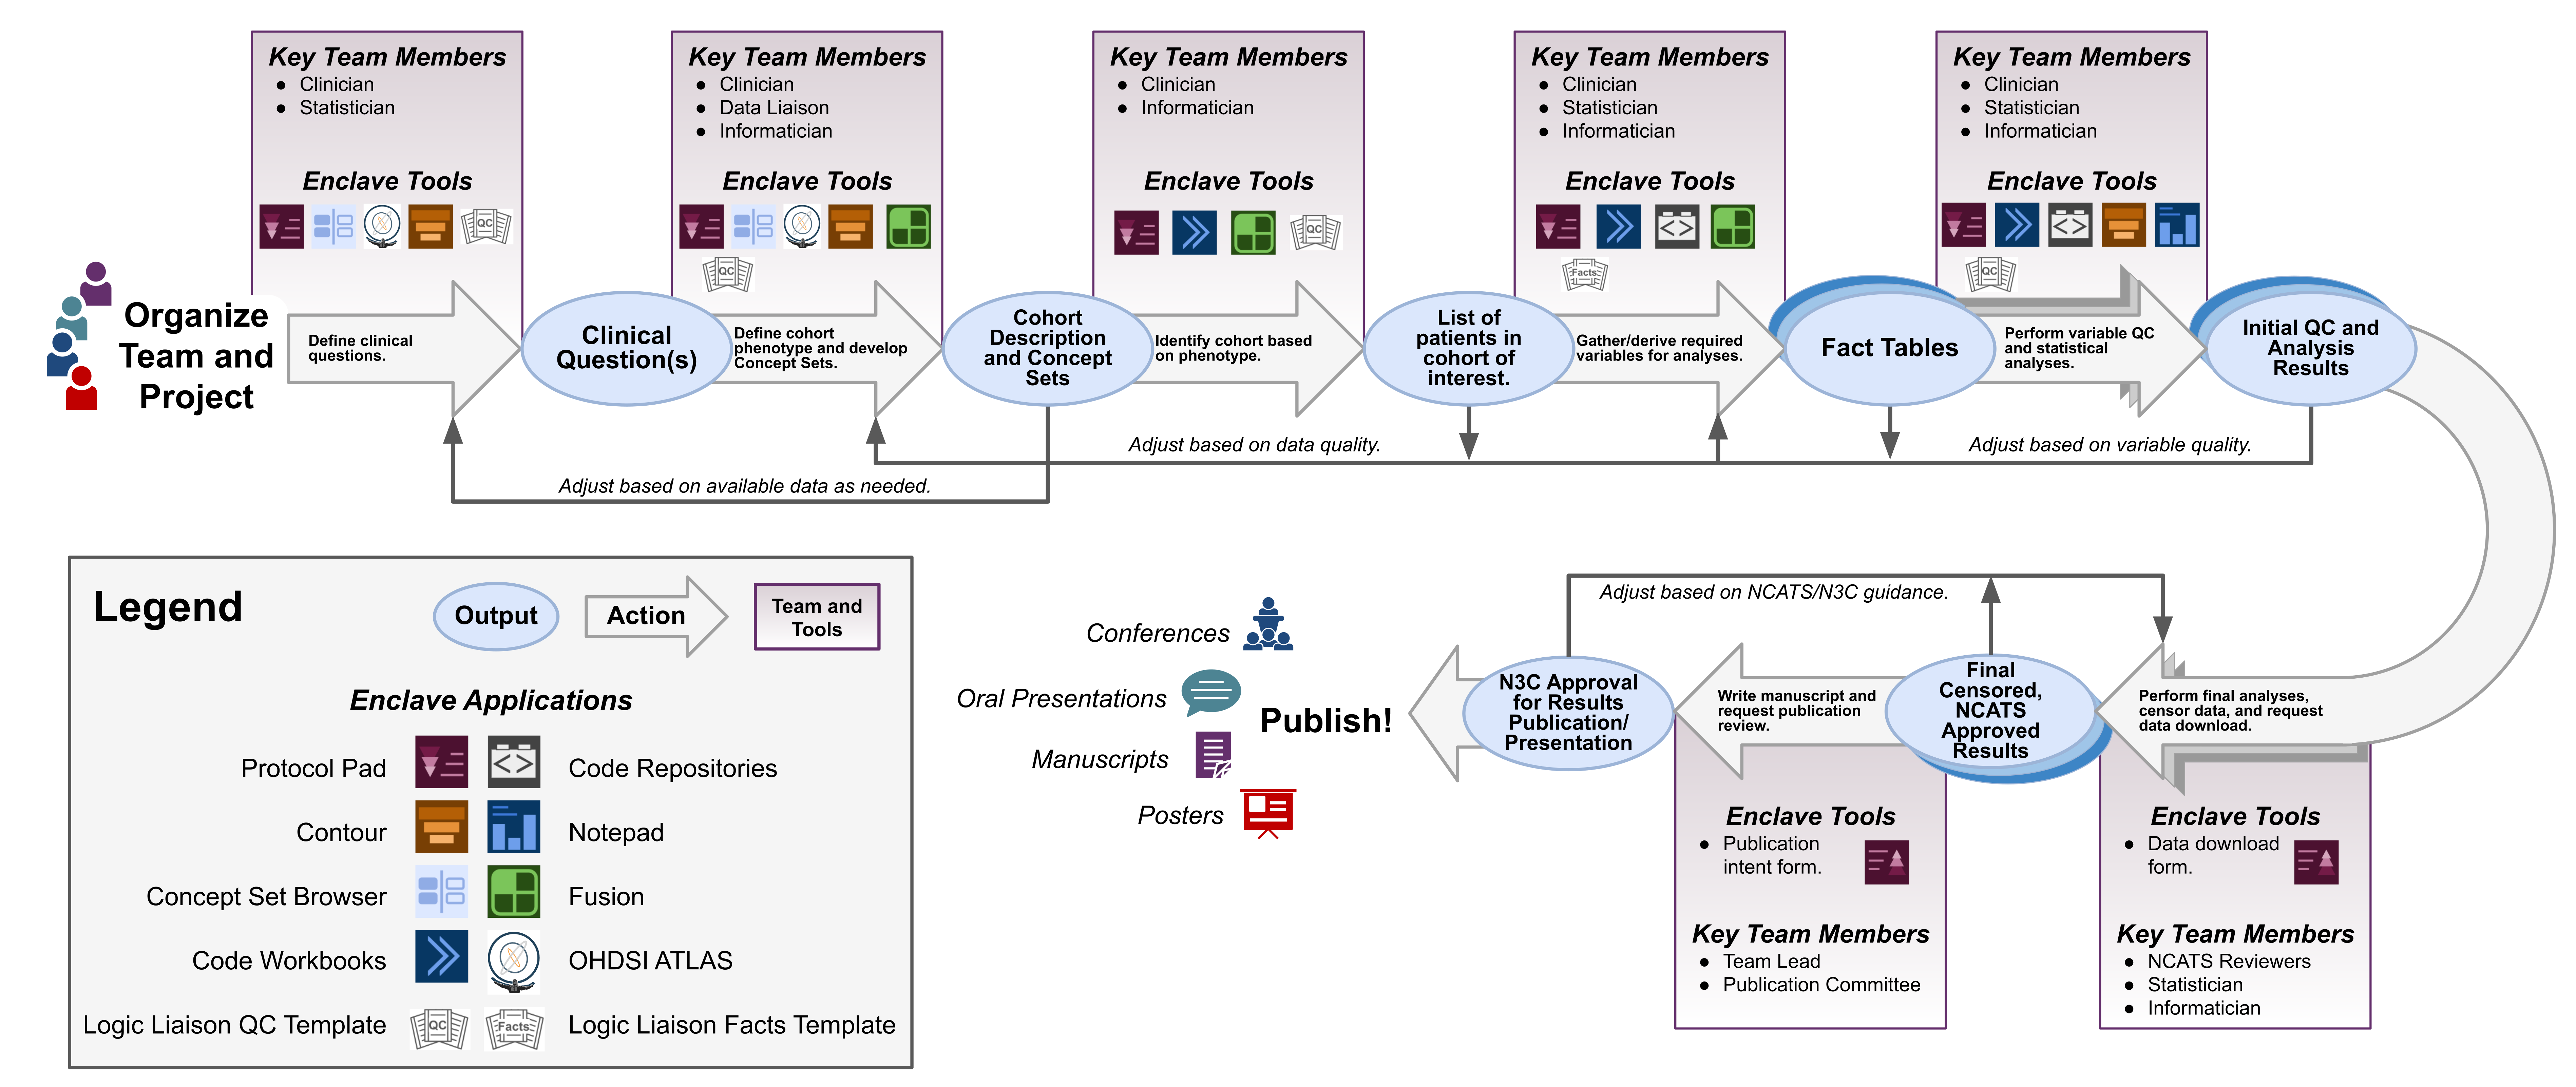
Due to the complexities of analyzing large clinical datasets, such as that compiled in the Enclave, it is common, and many times necessary, to work in multidisciplinary collaborative teams to answer a research question. Figure 8.1 provides a high-level overview of the process behind forming a team and performing research using the Enclave, along with the recommended field expertise needed during each phase. It is important to note that while certain team members may take the lead at various stages, a project benefits if all team members are engaged to some degree at all phases. Managing these collaborative and multi-faceted projects requires good recordkeeping. The N3C Protocol Pad is designed specifically for N3C research and to aid teams in designing, implementing, reporting, and publishing their work in a Findable, Accessible, Interoperable, and Reusable (FAIR) manner (Wilkinson et al., 2016) (see also https://www.go-fair.org/fair-principles/). Thus it is recommended that you utilize this tool throughout the implementation of your project.
A research project in N3C starts with organizing a team with the required expertise (clinical, informatics, statistical, etc), followed by defining clinical questions around COVID-19 and characterizing the cohorts needed to answer each, i.e., clinical phenotyping. Because the N3C contains real-world EHR data that is harmonized from multiple data models and dozens of institutions, some information needed to identify an ideal clinical phenotype may be missing or incomplete. Thus, it is important to assess what information is needed to create an N3C computational phenotype for your cohorts. This could include using conditions, labs, or medications as proxies to identify a cohort if some information is not available. Generally, clinicians or other subject matter experts are leading this process with informaticians/data scientists providing guidance on what information is included in the Enclave, what is missing or sparse, and overall data quality (see Chapter 9). Some data quality aspects can be easily obtained through the use of Logic Liaison Templates accessible through the N3C Knowledge Store. The Enclave application Contour can be utilized at this stage, along with Code Workbooks for quick querying and visualizing of the data. Additionally, Fusion can be utilized to keep track of developed concept sets and utilized to easily input them into Logic Liaison Templates.
The generation of a computational phenotype overlaps with the generation of concept sets (see Chapter 7 for details), and is often a cyclical process. Well-vetted concept sets are key to obtaining robust cohorts, thus, having a team member familiar with the organization of data and the OMOP vocabulary, such as a data liaison, who can work closely with a clinician is beneficial. Concept set generation can be done using the Enclave Concept Set Browser, or externally through OHDSI ATLAS.
Informaticians and data scientists then utilize the computational phenotype and vetted concept sets to generate fact tables (i.e., datasets containing information about each patient like demographics, comorbidities, lab results, etc) for the cohorts of interest using the raw OMOP tables, which requires specific knowledge of how to work with large datasets in a Spark environment. Fact tables include all the information needed to characterize a cohort and perform downstream analyses to answer your research questions. Facts can include patient demographics, socioeconomic status, COVID status/severity, medications, comorbidities, etc. Logic Liaison Fact Table Templates can provide you a boost by allowing fast and robust generation of commonly used facts using N3C-vetted concept sets and peer-reviewed code as a starter table. You can then append this base fact table to include project-specific facts needed for analyses. Figure 8.6 and Figure 8.7 in the N3C Knowledge Store section of this chapter provide a more detailed view of how Logic Liaison Templates can be integrated into a project to expedite fact table generation. The generation of the original fact tables from raw OMOP tables can be done using Code Workbooks (Section 8.4.3) or Code Repositories (Section 8.4.4).
Data scientists and statisticians can then analyze the extracted and formatted fact tables. This includes statistical tests, summary tables, visualizations, and reports for the team to discuss. Data analysis is also a cyclical process with all team members engaged in assessing results and circling back to further refine the computational phenotype and concept sets if needed. Depending on the type of analysis needed, Code Workbooks or Contour can be utilized at this step, followed by Foundry’s Notepad for reporting results for secure team dissemination within the Enclave environment.
Once you obtain results that you wish to share with others, all tables, figures, and other data needed for reporting in publications, conference submissions, presentations, or any other activity outside the Enclave environment must be submitted as a Data Download Request for a download review by NCATS (see Chapter 10). The download request is meant to ensure no prohibited data is being downloaded as per the N3C Data Download Policy summarized in the Publishing and Sharing Your Work chapter. After approval, your results can be included in research outputs, such as publications, and then submitted to the Publication Review Committee (see Chapter 10). This step is necessary to ensure data are being reported properly in the context of the research project and that proper attribution is being given to all those who contributed to the success of the research, either directly or indirectly. Upon approval, you are free to submit to the venue of choice and freely present the approved data to anyone at any time. Data download requests are performed within the Enclave environment, followed by submitting a Google Form to the Publication Review Committee.
The following sections of this chapter discuss each of the features and applications needed to perform research in the Enclave, and include links to external Foundry documentation, as well as direct the reader to other chapters of this book that contain a deeper dive into various N3C topics, such as the organization of data and best practices. This chapter is best utilized alongside the information provided in the next chapter, Best Practices for the Research Life Cycle (see Chapter 9), which includes information on recommended data workflows, such as scheduling automatic data builds, to keep your research current, managing your projects using the Protocol Pad, and much more.
8.2 Using Concept Sets
As discussed in the previous chapter Understanding the Data (see Chapter 7), the electronic health information coded in the various vocabularies used across the country are mapped to the OMOP common data model. By leveraging the hierarchical structure, parent codes and descendants can be captured in one fell swoop to create intensional concept sets for use in analysis.
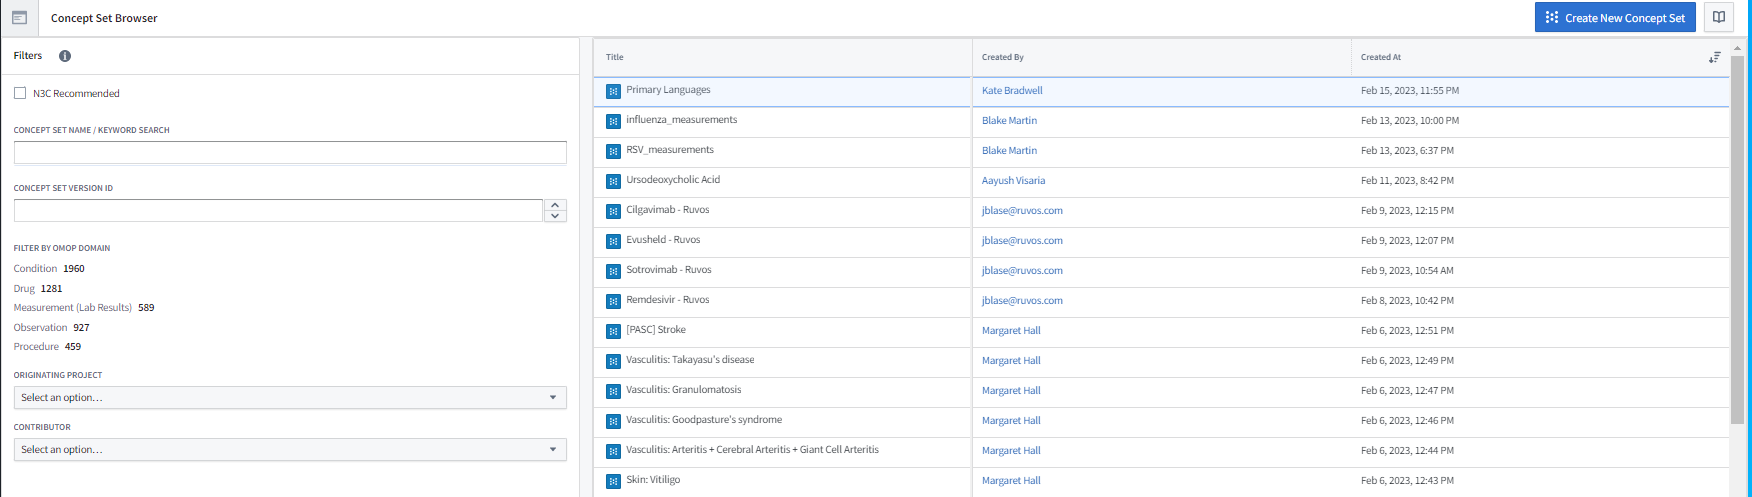
The Concept Set Browser shown in Figure 8.2 is an N3C-specific tool that allows you to explore and modify existing concept sets as well as create new concept sets to fit your exact study needs. For more details around the process of concept set creation, read the Concept Sets section in Chapter 7. It is recommended that, if you are a new researcher, you start your search for a concept set with the list of N3C Recommended concept sets. These concept sets have been frozen in their validated state by the Logic Liaisons and the Data Liaisons after obtaining clinician and informatic reviews (see Chapter 7). They are also the ones used to identify common comorbidities and other facts on the Phenotype Explorer and in the Logic Liaison Fact Table templates. The recommended other method of finding commonly used concept sets is by exploring bundles within the Concept Set Browser. These are groups of concept sets that are often used together. Further exploration of all other concept sets in the Concept Set Browser is also an option, though only advised when proceeding with the understanding that many of the existing concept sets that are not part of the N3C Recommended or bundles are crafted to be specific to one particular study team’s requirements.
Once concept sets have been identified for use in your analysis through the Concept Set Browser, the concept set members table becomes the link between concepts and the encompassing concept set as shown by Figure 8.3. You then have to “point” the code to the concept set members table to access this linkage. Once this has been accomplished, the choice becomes using the most recent version of a concept set (concept_set_members.concept_set_name where most_recent_version = TRUE) or using a specific version of the concept set (concept_set_members.codeset_id = {codeset id value}). While there are alternative ways to utilize concept sets and concept ids, the method described above is highly recommended primarily for the ability to quickly update a concept set without having to find and change hard-coded concept ids in a data processing pipeline.
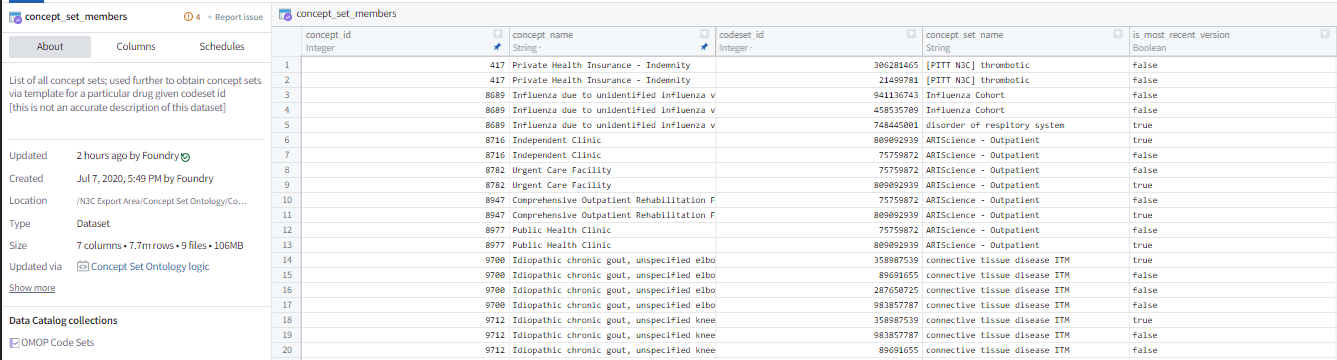
concept_set_members table.
Referring to a concept set by name and using the most recent version is often the preferred method for concept sets marked as N3C Recommended since these concept sets can only be updated by N3C core contributors after they have gone through a validation process which has been described in the previous chapter, Understanding the Data.
For concept sets that have not undergone the validation process and have not been marked as N3C Recommended by the N3C core contributors, it is recommended that the research team performs their own validation on an existing concept set or creates a new concept set with the input of a clinician. The concept set should then be referenced using its codeset ID when you are performing your data analysis. This will allow your team to perform their analysis from start to finish without worrying about unvalidated modifications to the concept set. However, the codeset id being referenced in the code may need to be updated if the team chooses to modify the concept set once starting the analysis.
In constructing phenotypes from concept sets, concept sets may also need to be joined together; these actions are best done in SQL/R/Python Code Workbook transforms with the use of the Logic Liaison’s Combined Variable template or in Code Repositories.
8.3 N3C Knowledge Store
The N3C Knowledge Store is an application where you, as an N3C Data Enclave user, can discover shared code templates, external datasets, reports, cohorts, and Python libraries (collectively also known as Knowledge Objects or KOs) and share similarly re-usable Knowledge Objects of your own with other Enclave users, regardless of the specific project from which the resource originated. Most Knowledge Store (KS) objects come about as core contributors and researchers alike develop resources they believe may be useful for others either within or outside of their research project team and wish to share them with the broader community. If you find yourself in this situation, you can easily create, submit, and share a KS resource by following this Code Workbook Template Quick Start Guide . Otherwise, more specifics on how to navigate the KS can be found in this Knowledge Store Guide within the Enclave.
8.3.1 Datasets
Of the many types of Knowledge Objects, the most common are datasets and code templates. Datasets in the Knowledge Store can be internal or external. Internal datasets are generated from data inside the Enclave, typically by researchers as part of their project, and are often of patient or row-level granularity. As described in the previous chapter Understanding the Data, external datasets found in the Knowledge Store provide a wealth of information from public datasets that have been brought into the Enclave along with the crosswalks necessary for joining these aggregate data to person-level data at various levels of granularity (see Chapter 7). Either type of dataset can be imported into a workbook or code repository of the appropriate data access level to be used as a starting point for further transformation or analysis.
8.3.2 Code Templates
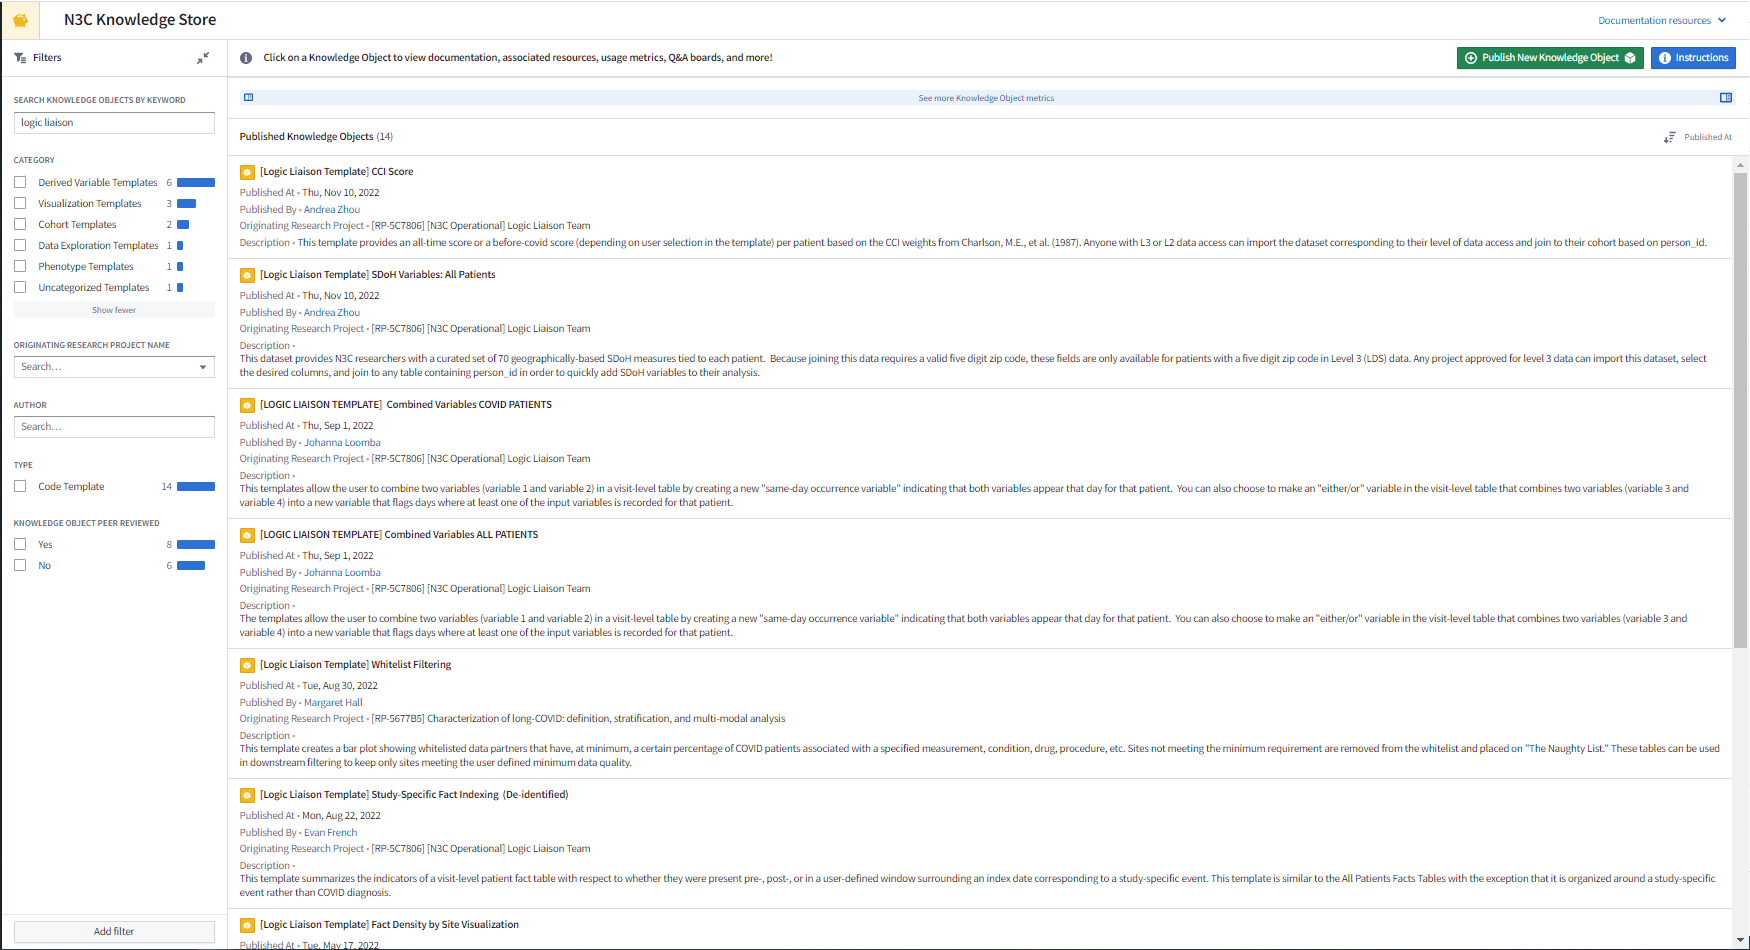
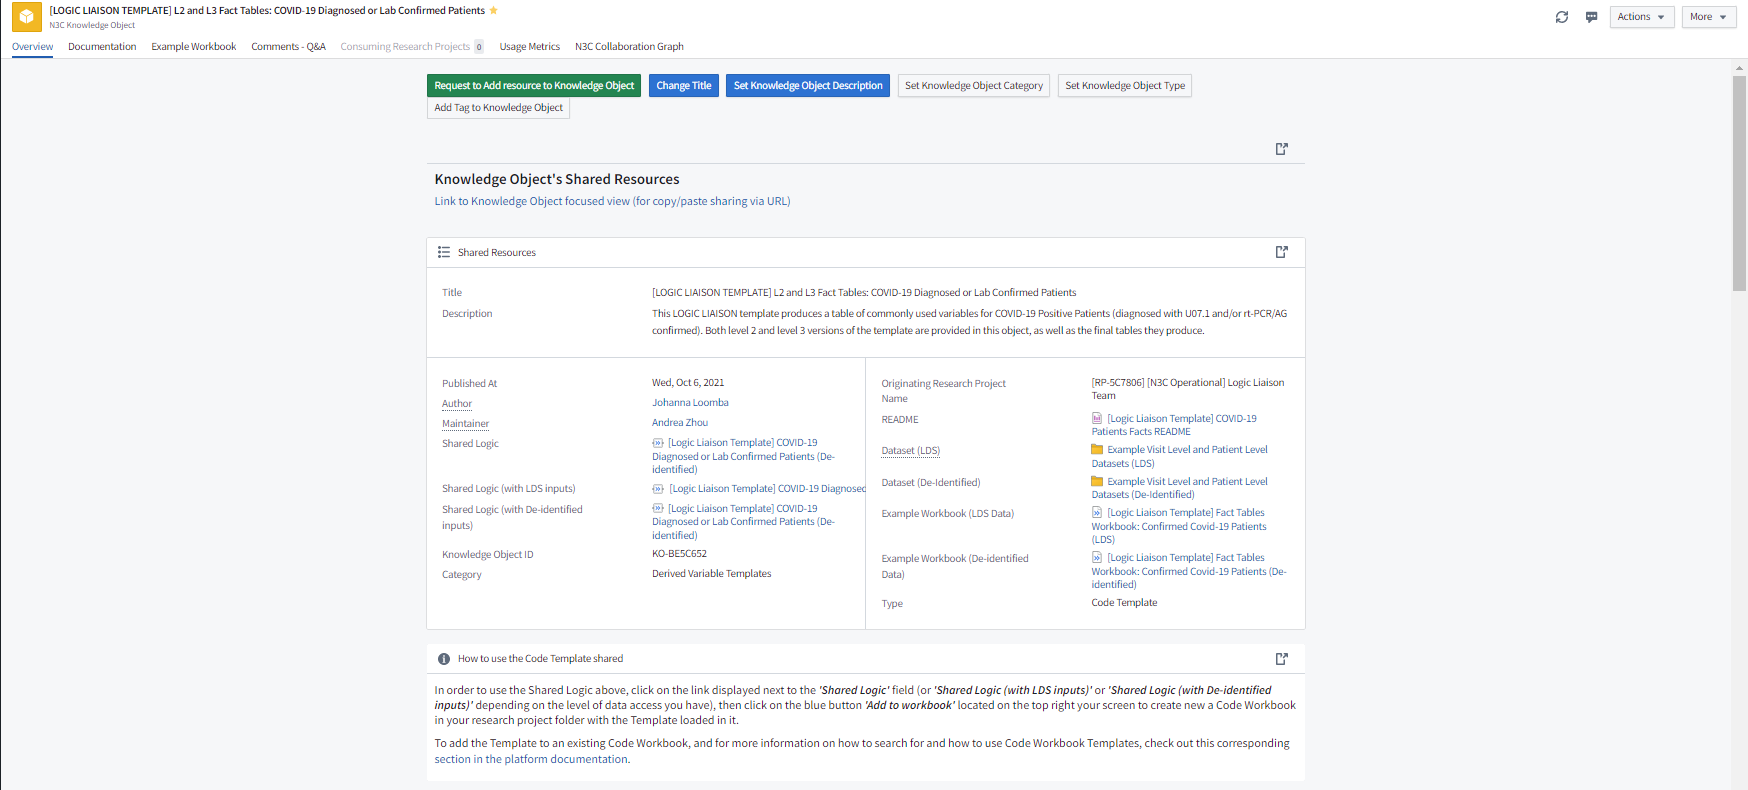
Depending on the author’s intended use, some code templates can be applied to your custom input dataset while other code templates produce a dataset that can be joined to your study dataset. The code templates themselves can also be imported and customized to produce a dataset for defining a study cohort with key information to use during analysis or simply used as example logic if you are newer to coding. Code templates, in general, are often meant to help transform the massive amount of raw data to smaller, more digestible, and more readily applicable datasets and facts. A few helpful starter templates are those produced by the Logic Liaisons (see the Logic Liaison Services section in Chapter 11), some of which can be seen in Figure 8.4.
8.3.3 Logic Liaison Fact Tables and Templates
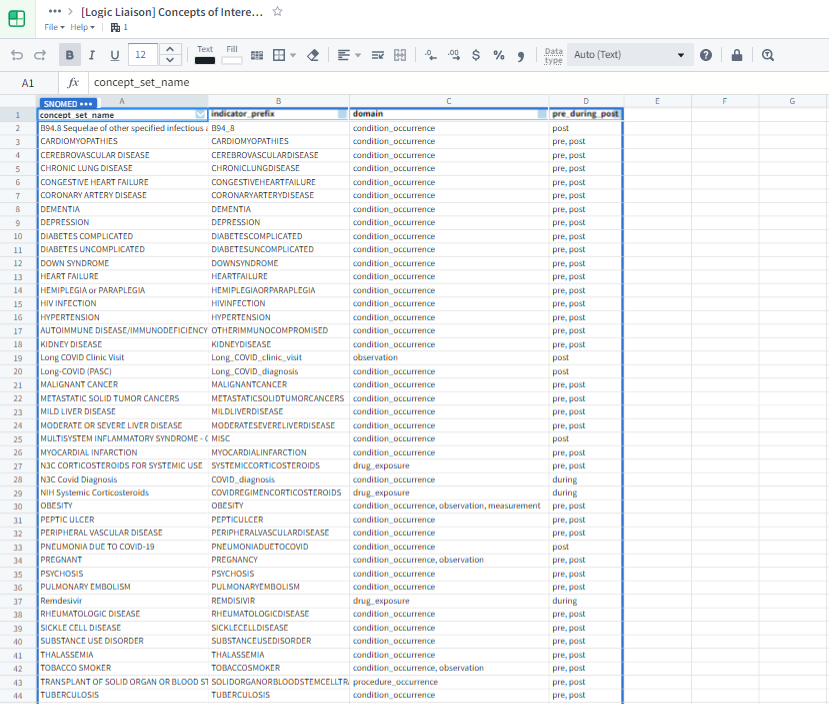
The Logic Liaison Fact Tables and Templates are specifically designed to provide a validated and community agreed-upon method for calculating particular facts at the date level and/or the patient level. Through surveying the Domain Team Leads to establish a list of commonly derived variables and continuous feedback from the N3C Community to refine and update this list, the Logic Liaisons have developed, disseminated, and maintain two main fact table templates and an additional fact table template for SDoH variables. These two main fact table templates each produce day-level and person-level data frames of commonly used derived base variables for all N3C patients as well as a subset who have an index date for their acute COVID-19 infection, the confirmed COVID-19 positive patients (PCR/AG positive or U07.1 COVID-19 diagnosed). These day-level and person-level datasets are commonly referred to as the Logic Liaison Fact Tables and can be imported directly into a workbook for use without modifying the template. These fact tables are produced using a default set of concept sets from the N3C Recommended Concept Sets list and a set of default values for the template’s parameters.
The main fact table template KOs include not only the shared logic for importing/customizing the template for both data access levels, but also a detailed README, example datasets (aka default Logic Liaison Fact Tables), and example code workbooks as exemplified by Figure 8.5. It is recommended you first open the README and example code workbooks to see how the default fact tables are generated and then decide whether you would like to use the fact tables as they are or import the template to customize concept sets and/or template parameter values to generate your project-specific version of the fact tables. The SDoH Variables ALL PATIENTS template provides you with a curated set of 70 geographically-based SDoH measures tied to each patient. Because joining this data requires a valid five-digit zip code, these fields are only available for patients with a five-digit zip code in Level 3 (LDS) data.
The Logic Liaisons have also developed, disseminated, and maintained a handful of overall data quality templates, ancillary fact table, and ancillary data quality templates in the Knowledge Store. Figure 8.6 depicts how one could apply the set of Logic Liaison Templates to generate augmented fact tables with a goal of asking one or more research questions within that project.
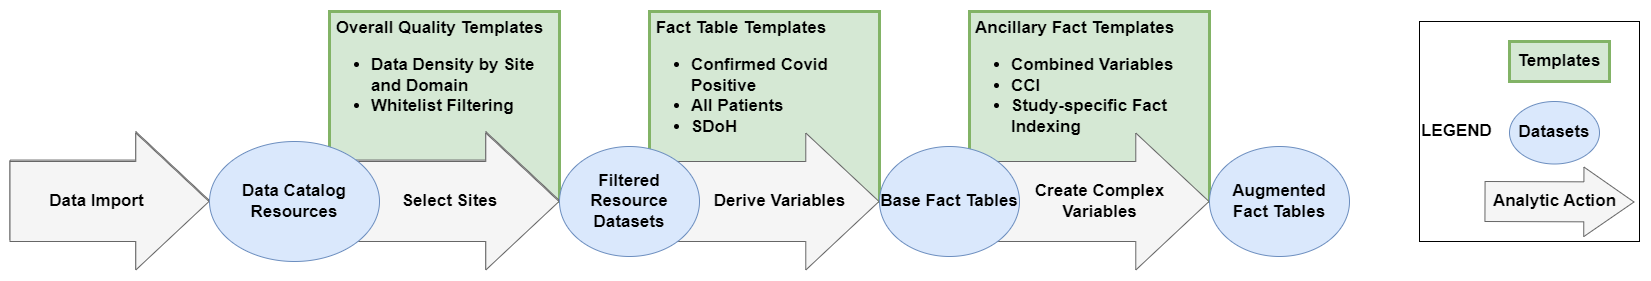
The data quality templates provide a variety of data tables and visualizations. The first two of which provide a method for evaluating overall quality of the harmonized data ingested from sites.
- Data Density by Site and Domain : Calculates the Standardized Density, Median Absolute Deviation (MAD), and Directional Median Deviations (DMD) with respect to the number of unique patient/concept/days for each of the major OMOP tables (i.e., condition_occurrence, drug_exposure, etc) and uses them to create a heatmap displaying how many MADs each site is from the median for each OMOP table. The template also scores the site’s date-shifting practices.
- Whitelist Filtering : Creates a bar plot showing whitelisted data partners that have, at minimum, a certain percentage of COVID patients associated with a specified measurement, condition, drug, procedure, etc. Sites not meeting the minimum requirement are removed from the whitelist. These tables can be used in downstream filtering to keep only sites meeting the user-defined minimum data quality.
Once the main fact table templates mentioned earlier this section have been applied to generate the base fact tables, the ancillary fact templates utilize the day-level and person-level datasets of the base fact templates to efficiently generate additional derived variables based on broadly requested and applicable logic such as:
- Vaccine Fact : Creates a vaccine fact table at the person level that summarizes their vaccination information
- Study Specific Fact Indexing : Summarizes the indicators of a visit-level patient fact table with respect to whether they were present pre-, post-, or in a user-defined window surrounding an index date corresponding to a study-specific event. This template is similar to the All Patients Facts Tables with the exception that it is organized around a study-specific event rather than COVID diagnosis.
- Combined Variables ALL PATIENTS : Allows you to combine two variables (variable 1 and variable 2) in a visit-level table by creating a new “same-day occurrence variable” indicating that both variables appear that day for that patient. You can also choose to make an “either/or” variable in the visit-level table that combines two variables (variable 3 and variable 4) into a new variable that flags days where at least one of the input variables is recorded for that patient.
- Combined Variables COVID PATIENTS : Same as above except for patients with facts found based on their covid index date.
- CCI Score : Provides an all-time score or a before-or-day-of-covid score (depending on your selection in the template) per patient based on the CCI weights (Charlson et al., 1987).
Figure 8.7 is a continuation of Figure 8.3 to demonstrate how you could continue to apply the Logic Liaison Templates to the augmented fact table created in order to answer their specific research question within a project.
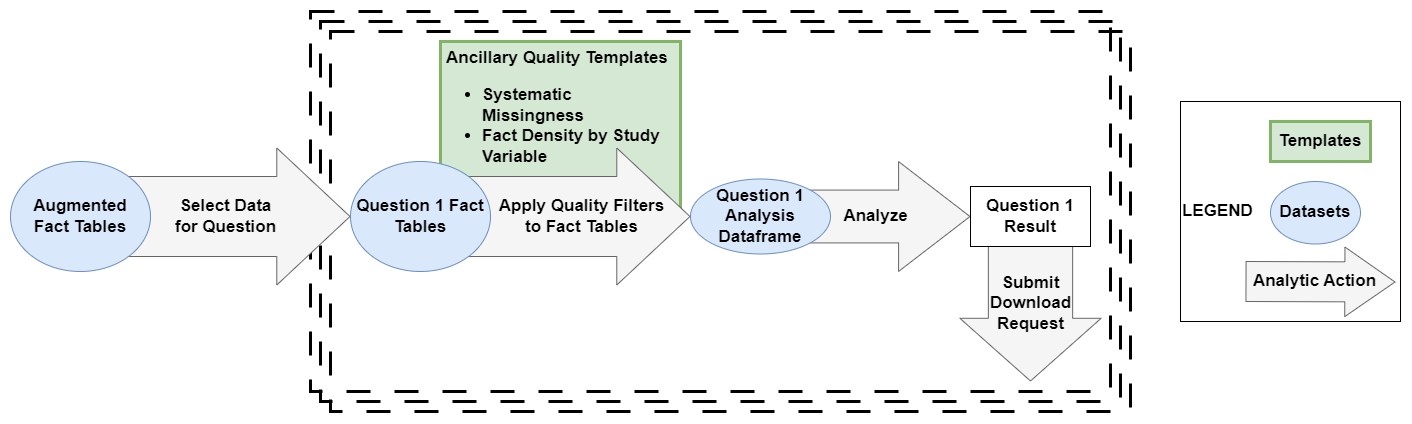
The ancillary data quality templates are intended to be applied to fact tables after cohort creation and initial variable creation to stratify question-specific facts by site.
- Systematic Missingness by Site and Study Variable : Produces a final visualization that has a binary indicator for whether or not a site is systematically missing meaningful data for the study variables in the input dataset
- Fact Density by Site Visualization : Calculates the Standardized Density, Median Absolute Deviation (MAD), and Directional Median Deviations (DMD) with respect to the numerical values in each column of the input table (any non-numerical field is converted to a binary value using the isNotNull() function) and creates heatmaps to visualize the metrics.
Once you obtain results you wish to share outside of the Enclave for a project, the results must undergo a Data Download Request before being available to export outside of the Enclave. Additional details around exporting results can be found in the Publishing and Sharing Your Work chapter (see Chapter 10). Training materials for getting started with Logic Liaison Templates are available here within the Enclave. Outside of the main confirmed COVID+ template and a subset of columns in All Patients, these templates could be generalized to apply to research projects outside of the Enclave where studies do not necessarily need to fall within the scope of COVID-19.
While it is not necessary to utilize Knowledge Store resources when conducting your research project, it does allow you to get a jump-start on gathering and understanding the data by avoiding effort duplication and providing a general starting point. You can then build upon this fact table using the ancillary templates that allow self-definition of the index event, combining variables, generating a CCI score, and associating SDoH variables based on zip code crosswalks. The Logic Liaison ancillary data quality templates provide the same structure for analyzing data missingness, density, and contribution quality by site. Further explanation as to why these Knowledge Store objects are highly applicable can be found in Best Practices for the Research Life Cycle (Chapter 9).
8.4 Enclave Applications
This section will cover the usage of various applications made available in the N3C Data Enclave, including Protocol Pad, Contour, Code Workbooks, and more (a complete list of Foundry applications can be found here). Before designing and running an analysis utilizing data in the Enclave, it helps to understand the concepts of a “data pipeline” and a “data transform” as well as how the data are stored and accessed via Apache Spark on a distributed file system.
8.4.1 N3C Protocol Pad
N3C Documentation: Quick Start Guide and Detailed Instructions .
- Electronic lab notebook
- Promote collaboration, organize work, and translation to final manuscript
- Methodology checklist
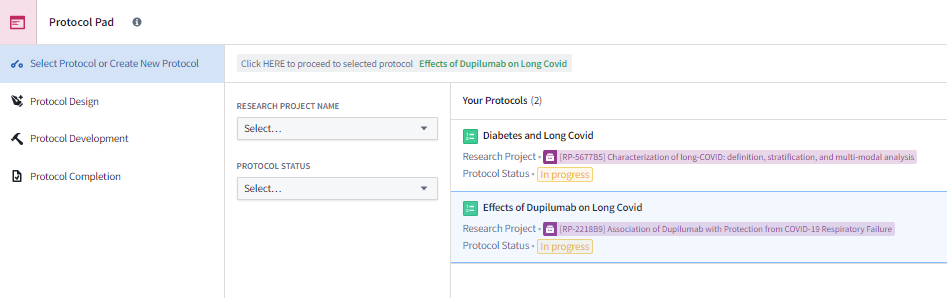
Before diving into an analysis, it is highly recommended that you use N3C’s Protocol Pad shown in Figure 8.8 to organize your thoughts and path forward. Research studies can span many months and pass through the hands of many team members before reaching a stage where you may want to share the results through publication or other approved means. The Protocol Pad serves as an electronic lab notebook to help organize tasks, track progress, and document results in a cohesive format throughout the process of reaching a study’s final state. As a result of this organization and tracking, the tool facilitates easy translation of the work, decisions, and contributors to producing a final manuscript if that is the goal of the protocol.
Protocol Pad is the foundation for performing reproducible and repeatable science within the Enclave. The templates, checklists, and links to key resources provided within the tool guide you along the path of a well-structured division of labor and use of best practices when performing research using the observational data in the Enclave. The tool also assists your team in keeping the work in alignment with the project. A more in-depth explanation of how Protocol Pad can facilitate research will be available in the future. Documentation on the tool’s functionality can be found in the QuickStart Users’ Guide to Protocol Pad as well as the Protocol Pad White Paper and Detailed Instructions .
8.4.2 Contour
Foundry Documentation: Contour Overview
- Programming-free analysis interface
- Point-and-Click data analysis pipeline development
- Data summary and visualization
- Allows customization with Contour’s expression language
- Dashboard development
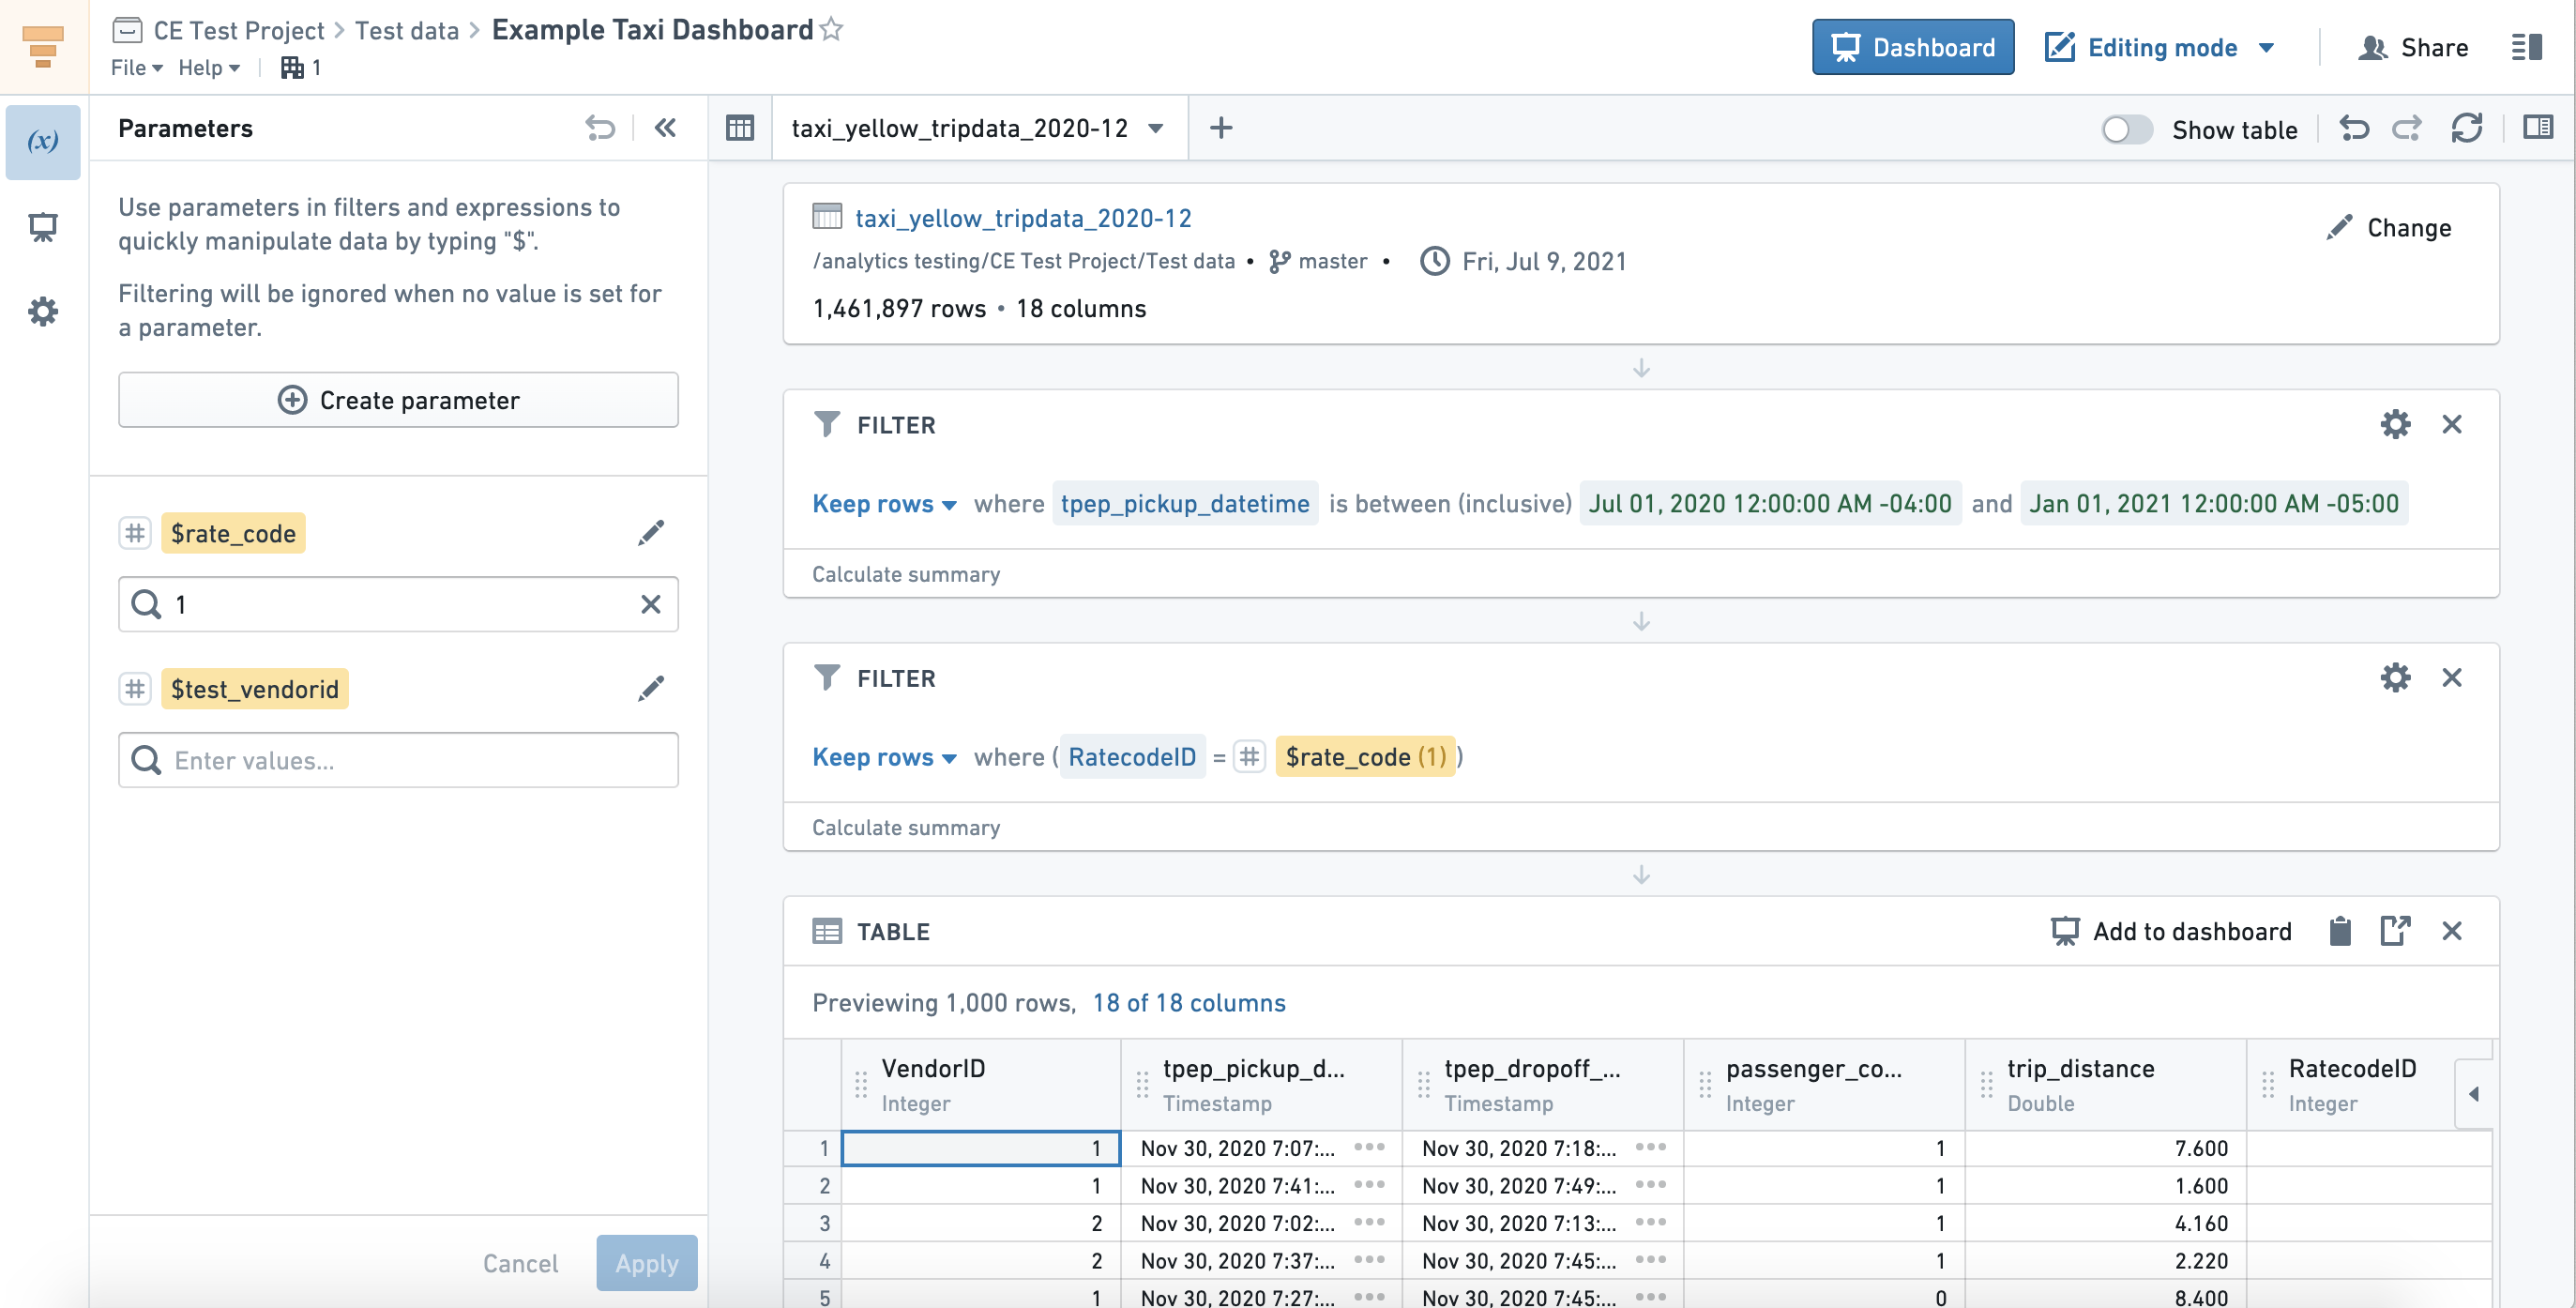
The Contour application is a programming-free interface to the Enclave that allows those with limited knowledge of Python, R, and SQL to create top-down analysis pipelines in a point-and-click fashion, as well as generate dynamically updated dashboards. A Contour analysis starts by specifying the path to the input dataset as shown in Figure 8.9. Subsequent transforms of that dataset are then specified, which can include adding/calculating new columns, filtering rows or columns, joining with other datasets, creating summary figures and charts, summarizing tables through pivoting, and more. Contour’s expression language also allows for more complex querying and data aggregation beyond the default operations provided. Once an analysis is complete, resulting datasets can be saved to the Enclave for use in additional Contour pipelines or other Enclave applications, like Code Workbooks. Contour can also quickly create summary figures from source tables without code, and has a variety of visualization options, including bar charts, histograms, and heatmaps.
Figures or summary tables created in Contour can be exported to a dashboard within Contour. A Contour Dashboard allows chart-to-chart filtering, and an easy drag-and-drop interface to build the dashboard while iterating on an analysis. A dashboard is dynamic and interactive, allowing the reader to adjust the graphs to better explore analysis results in a guided and structured way. Figures generated in a Contour analysis can also be exported to other Enclave applications like Notepad for reporting results. The main difference between Notepad and a Contour Dashboard is that Notepad provides a static report with figures that cannot be dynamically changed by the reader. A detailed orientation to Contour can be found in the Foundry Documentation here.
8.4.3 Code Workbooks
Tutorial: Intro to Code Workbook
Foundry Documentation: Code Workbook Overview
- Graphical organization of logic
- Simplification of code
- Easy reuse of pre-authored logic
- Add visualizations to reports
- Supports Python, R, SQL, PySpark, and SparkR
- Console debugging and development
- Branching facilitates collaboration and reproducibility
- Workspace to reuse templatized logic
- Exporting code to GitHub
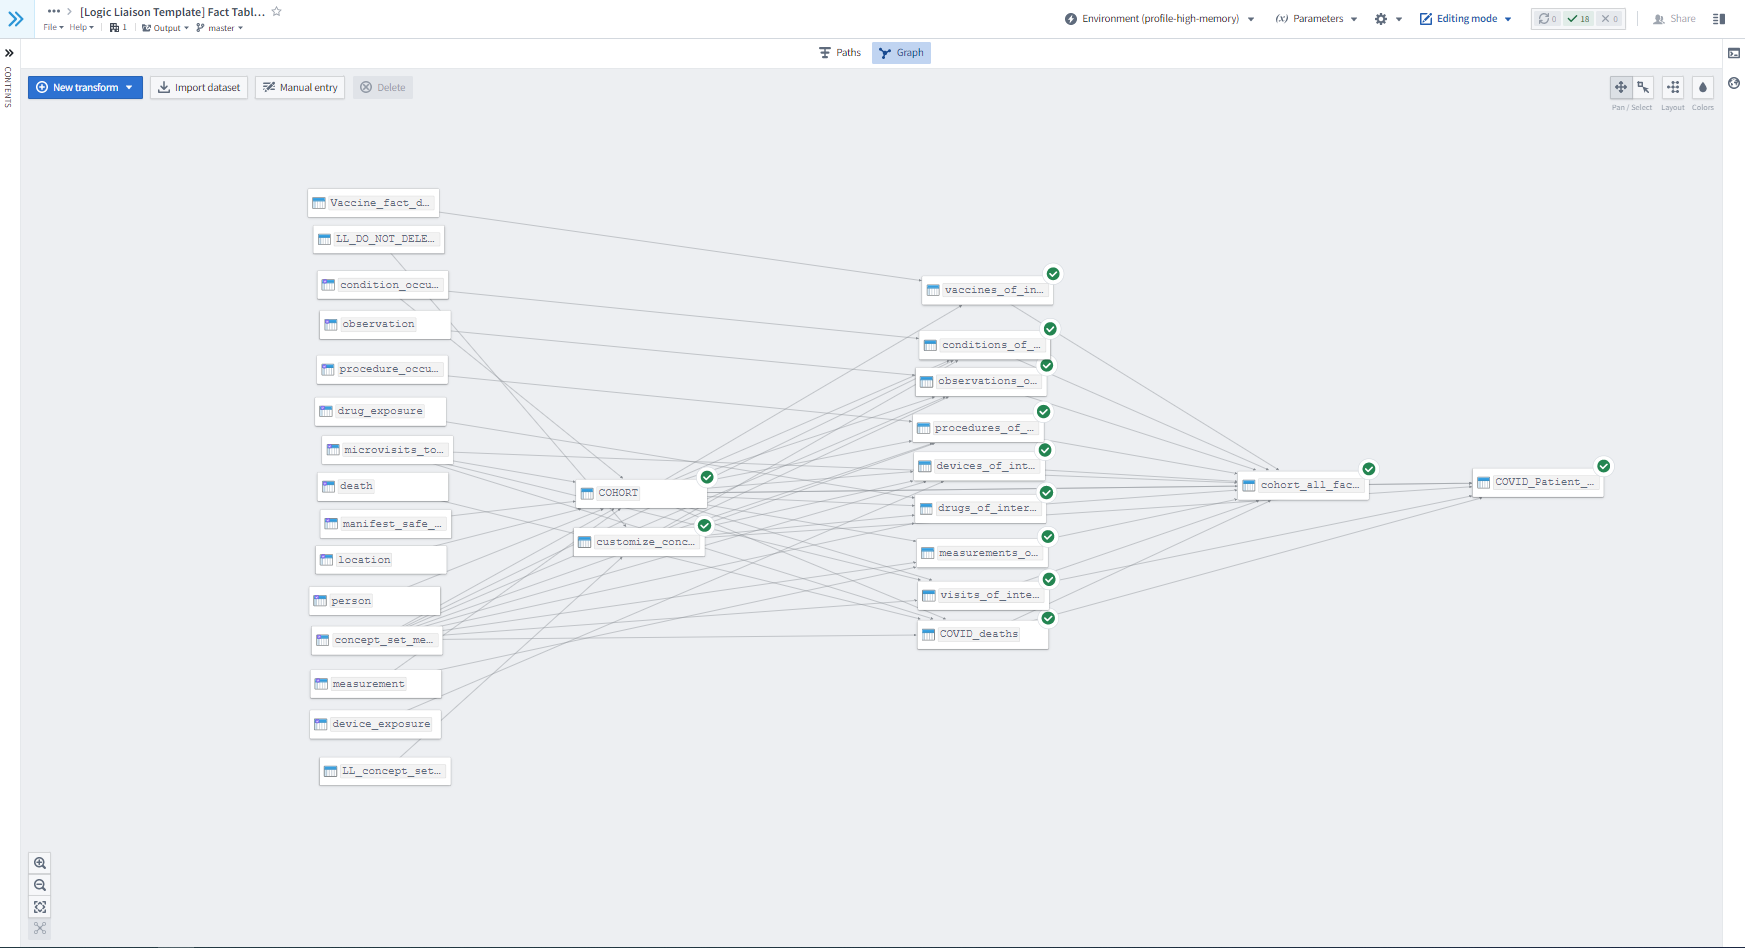
Code Workbook is a GUI-based application for you to apply code-based transformations to datasets for the purpose of creating new datasets and visualizations. The explicit goals of the application are to facilitate a collaborative environment in which you can quickly iterate over logic to produce artifacts interoperable with the suite of Enclave applications. The default Code Workbook interface is structured as a directed graph in which nodes represent either datasets or transformations that output datasets. Edges represent the flow of data through the graph such that upstream datasets are inputs for logical operations performed by downstream code transforms. Figure 8.10 shows an abstract version of a Code Workbook, while Figure 8.11 is an actual screenshot in the Enclave where data flows from the left to the right. Any dataset which you have access to within the workspace where the Code Workbook is located can be imported as an input to the various types of transformations. For each transformation one or more tables are specified as the input and are transformed into a single output table (Figure 8.10). Multiple transformations can also be strung together (Figure 8.11) to create an analysis pipeline (see Foundry’s Anatomy of a Data Pipeline module for more detailed information, as well as Chapter 9). In Code Workbook, the primary and required output of a transformation is always a single table; however, visualizations such as graphs and charts can also be generated and saved along the way. Note that the code performing the transformation and the resulting output table are always represented as a single node in the Code Workbook interface.

8.4.3.1 Types of Transforms
- Manual Entry transforms allow you to manually populate a custom dataset directly in the specific Code Workbook you are currently working in as a “quick and dirty” alternative to manually populating importable or referenceable datasets with Fusion).
- Python/PySpark Code transforms contain a Python function that takes one or more datasets as input parameters and returns a single dataset as output.
- R/SparkR Code transforms contain an R function that takes one or more datasets as input parameters, and outputs a single data frame.
- SQL Code transforms let you write a Spark SQL query to create a new dataset from the available input datasets.
- Template transforms are parameterized blocks of reusable code which you can configure from a point-and-click interface. Many code templates are available in the Knowledge Store, but you can create your own templates scoped to their workspace. Multiple single-node templates can be combined to create a multi-node template to allow reuse of entire configurable pipelines.
- Visualize transforms offer a point-and-click interface for you to create figures and pivot tables. Note this transform is only available for use on saved datasets; it cannot accept unsaved transformations as an input parameter.
Both Python and R transforms can optionally return a single dataset and produce visualizations using Python libraries/R packages. Any visualization produced in a Code Workbook can subsequently be embedded in a Notepad document. Datasets returned by a transform are ephemeral by default, that is, the transform must be recomputed each time the dataset is used as a downstream input, but options exist to conserve compute power by either caching or saving the output. Caching stores the output temporarily, while saving the dataset stores it permanently in the Enclave. It is recommended that transforms in a pipeline requiring significant compute time be saved as datasets to reduce iteration time during development. In addition to manually clicking “Run” on a transform, a build schedule can be defined to recompute it at regular intervals based on a trigger. You can choose the trigger to be the successful update of an input dataset or simply the elapsing of a specified period of time. This capability can best be visualized using Data Lineage.
The Console, Global Code, and Logs panels facilitate quick iteration and code development and debugging. The Console allows you to interactively execute and check syntax in Python, R, or SQL outside of a transform node. Global Code allows you to define custom functions available to all transforms in the Code Workbook. Each code transform includes a Logs panel to view console output generated by code and to view detailed stack traces when transforms fail due to an error.
Many Python and R transforms rely on external libraries and packages which can be made available via the Environment Configuration. The Enclave provides default configurations tailored to common use cases. For instance, the default profile includes common packages like pandas and tidyverse for routine analysis, whereas the profile-high-memory profile includes packages like foundry_ml for machine learning. You can create your own Environment Configurations which include packages meeting your project’s specific needs.
Not all libraries and packages are included in the list of options, but you can submit a ticket within the Enclave by clicking on Help & Support > Help Center > Report an Issue to request additional packages be made available. The Enclave maintains instances of the default configurations on warm standby, allowing them to be quickly initialized when you request a new environment. Custom configurations require more time for initialization as instances of these must be started from scratch rather than merely assigned. For this reason, it is recommended to use default configurations when possible.
Following best practices for collaborative software development, Code Workbook allows for branching of the logic within a workbook. As with other popular version control technologies (i.e., Git), branching allows you to make copies of a workbook which your team members can develop independently of the source workbook. Once the development in a particular branch is deemed complete, it can be merged back into the originating branch. Prior to the merge, you can preview both line-level differences within each node, as well as node-level differences of nodes that have been added/removed. Good practice dictates that you perform all development on individual branches, which are then merged back into a common master branch.
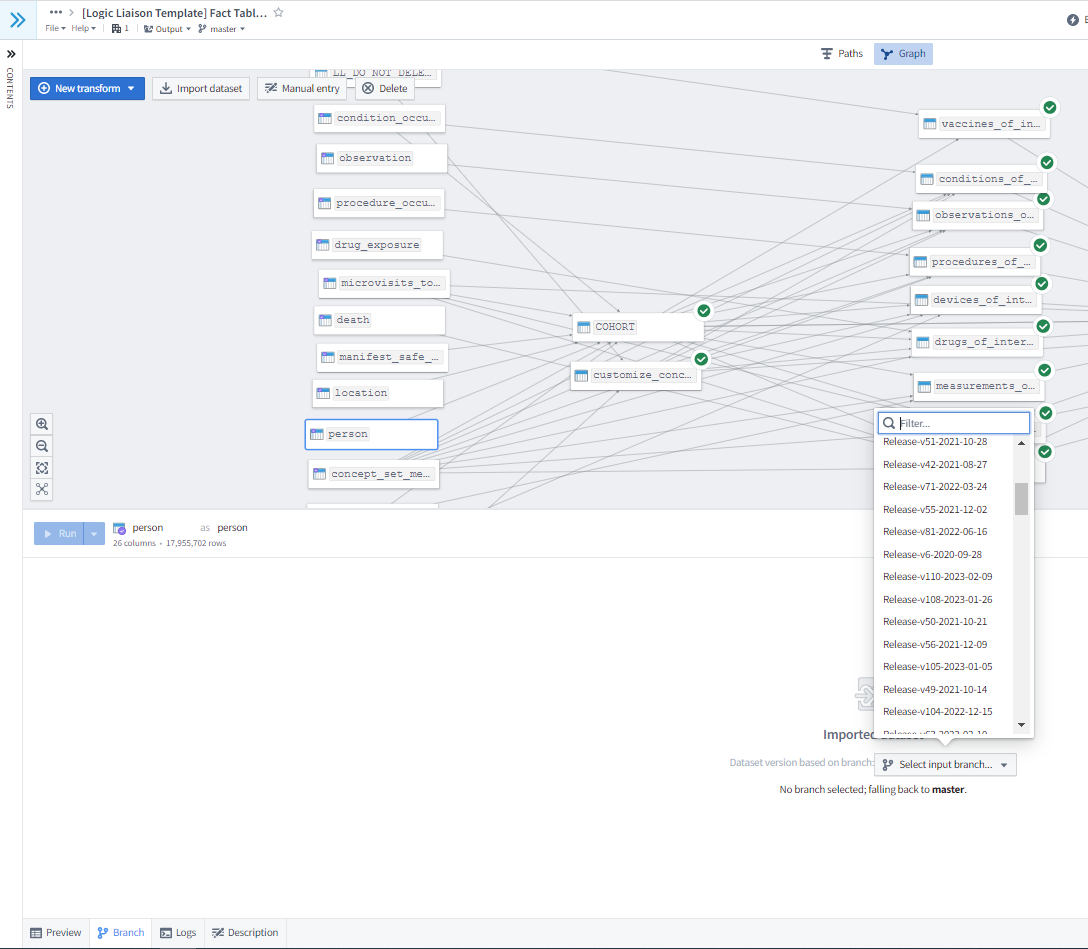
Because the master branch can change in the interval between you creating a branch and merging it back in, it is important to preview merge changes to ensure that the branch’s contributions are both correct and compatible with the current state of the master branch. However, note that your branch will be automatically deleted after it is merged, which is an important difference from the normal Git behavior. Another prime use case for code branching is to ensure the reproducibility of a given dataset used in a research project. Because the OMOP and N3C-curated datasets are also versioned, you can create a code branch in which all input datasets are set to the same version release (as shown in Figure 8.12) to effectively freeze a dataset used in a specific analysis for later reproducibility while still allowing the possibility of adding additional features. User-generated datasets are set to the same branch as the Code Workbook in which they were created. Finally, Code Workbooks allow you to collect and download all coded transformations within a single workbook into a Git repository that can be easily uploaded to GitHub for public dissemination.
Palantir has created extensive documentation of the Code Workbook application including tutorials. N3C has also published training materials .
8.4.4 Code Repositories
Foundry Documentation: Code Repository Overview
- Production pipelines
- Code reuse across projects
- Built-in version control
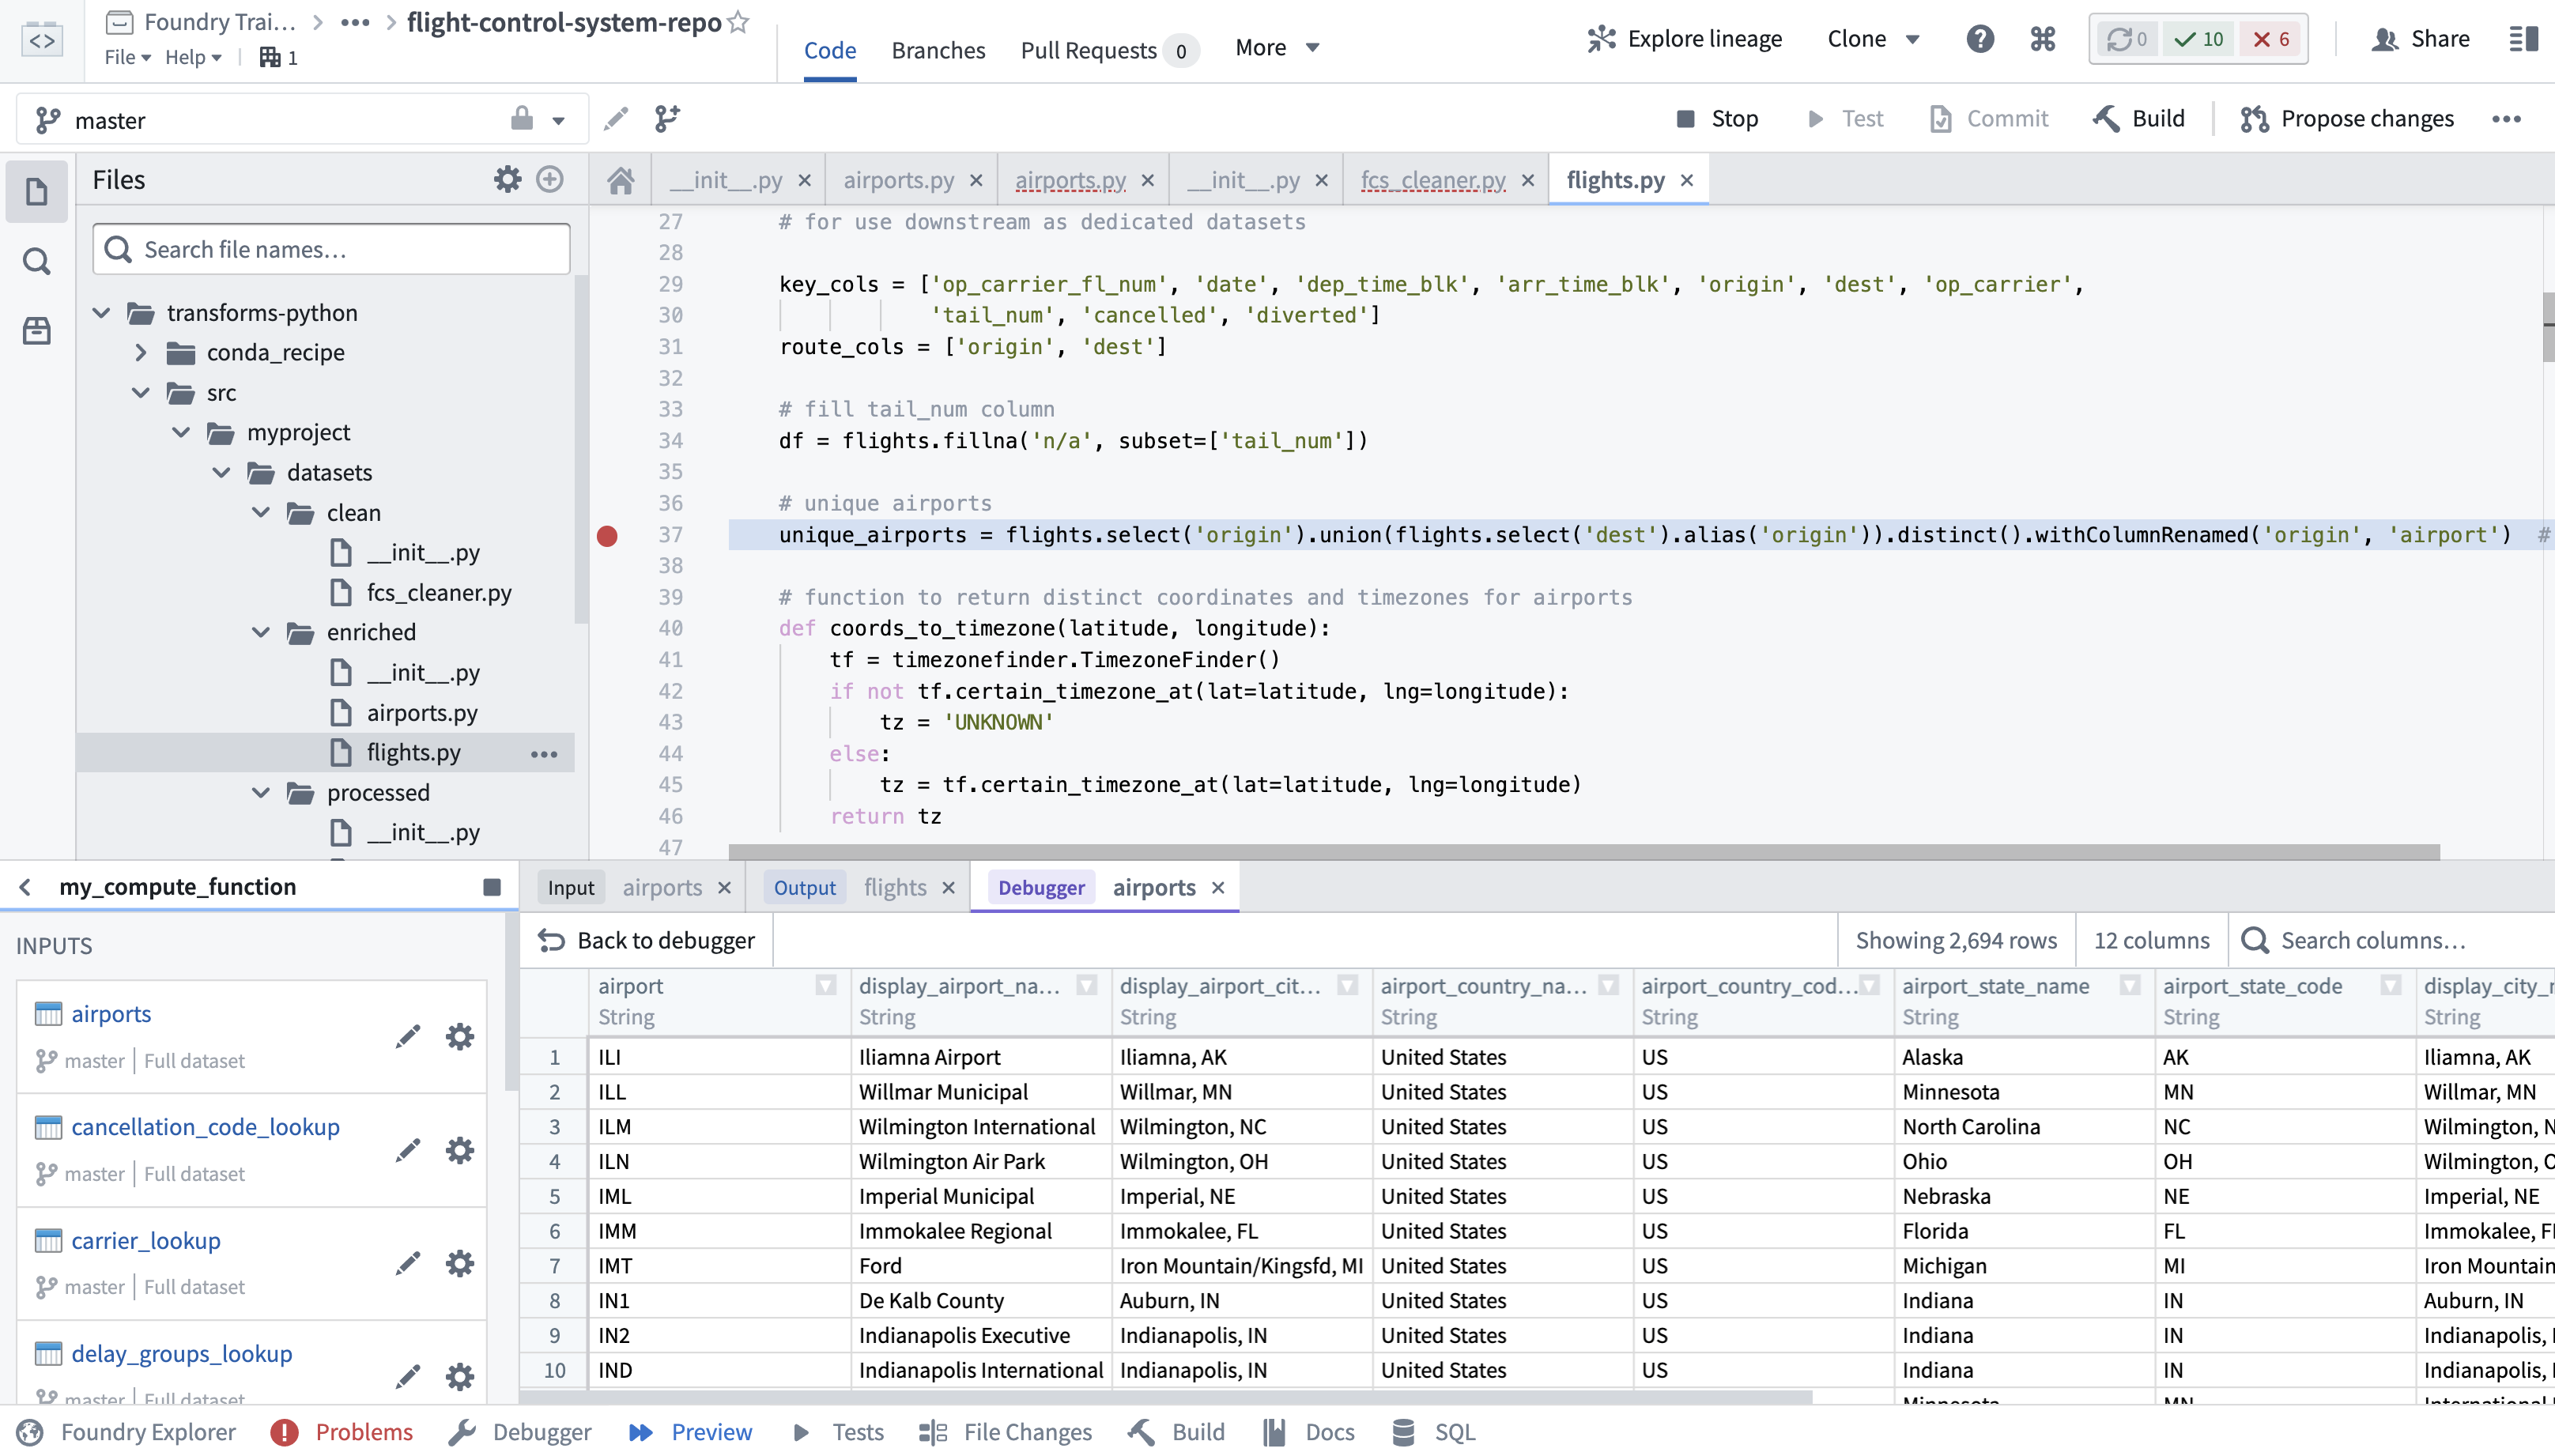
Code Repositories shown in Figure 8.13 are available within the Enclave and should be used when you wish to share code across multiple Code Workbooks or projects, or need to develop a robust production pipeline. Code Repositories do not support data visualization, coding in R, or point-and-click templates. Additional differences between Code Repositories and Code Workbooks can be found in the Foundry Documentation. Palantir has also compiled several tutorials on how to create, publish, and maintain Code Repositories .
For any large analytic project, there are many pieces of code and other artifacts that should be shared between different components within the project. Some code is useful enough that it should be shared across projects. Code Repositories provide a standard mechanism for encapsulating reusable components and allowing them to be reused within projects.
Underlying the Code Repository is the Git version control system. You can edit and maintain code using all of the capabilities of Git including comparing versions, branching, and pull requests. Versions that are tagged in Git will be automatically published in the Enclave as a shared library, which allows you and others that have access to your project space to import that code into other Code Workbooks (note this requires you to create a customized environment that imports your code specifically, which may increase workbook initialization time). If you want to make your repository public so others outside of your project workspace can use it you can do one of the following:
- Package your code into a properly structured Python package. This allows other researchers from different project spaces to run it from their Code Workbooks or Repositories.
- Submit the Code Repository to the Knowledge Store where it will then be visible to anyone who has Enclave access.
- Publish the Code Repository to a public Github where the code will then become accessible to anyone outside the Enclave.
More information on Code Repositories can be found in the Foundry Documentation (Palantir, 2023).
8.4.5 Fusion
Foundry Documentation: Fusion Sheet Overview
- Useful for writing back datasets for use within the Enclave
- Leverage cell references and spreadsheet functions
- Sync tables to a dataset to use in other Foundry applications
- Create charts
- Allow customization and flexibility
Fusion, shown in Figure 8.14, is a spreadsheet application within the Enclave analogous to Microsoft Excel or Google Sheets. Palantir provides extensive documentation. Fusion allows you to sync specific cell ranges within a spreadsheet to Spark datasets, which can subsequently be imported into any other Enclave application. Fusion is an excellent option for use cases which require manual data entry, such as curating lists of concept sets (see Chapter 7) to configure the Logic Liaison Fact Tables and Templates. Unlike many other Enclave applications, Fusion is not suitable for large datasets; each document has a maximum size of 50 MB. Similar to Google Sheets, multiple users can simultaneously view and edit the same document.
Fusion provides many features familiar to other spreadsheet applications such as cell-referencing formulas, formatting, and a charting library to name a few. While you cannot directly import external .xls/.xlsx formatted files into the Enclave, you can copy/paste external dataset values into Fusion. For example, you can copy and paste concept IDs from ATLAS to use in an analysis or in metadata manually curated for a dataset. To import larger external datasets into the Enclave see Chapter 7, and N3C procedures and protocols around importing large external datasets. In addition to standard spreadsheet functionality, Fusion has additional features which allow it to integrate with the rest of your Enclave environment. Objects created within Fusion, such as formatted tables, can be embedded in Notepad. Finally, Fusion sheets can be templatized to facilitate replication of similar functionality.
8.4.6 Notepad
Foundry Documentation: Notepad Overview
- Note-taking with ability to add embeds of the workflow
- Documentation of pipelines or datasets
- Create report templates
- Monthly status reports using template function
- Unable to create dashboard or complex page-based text editing
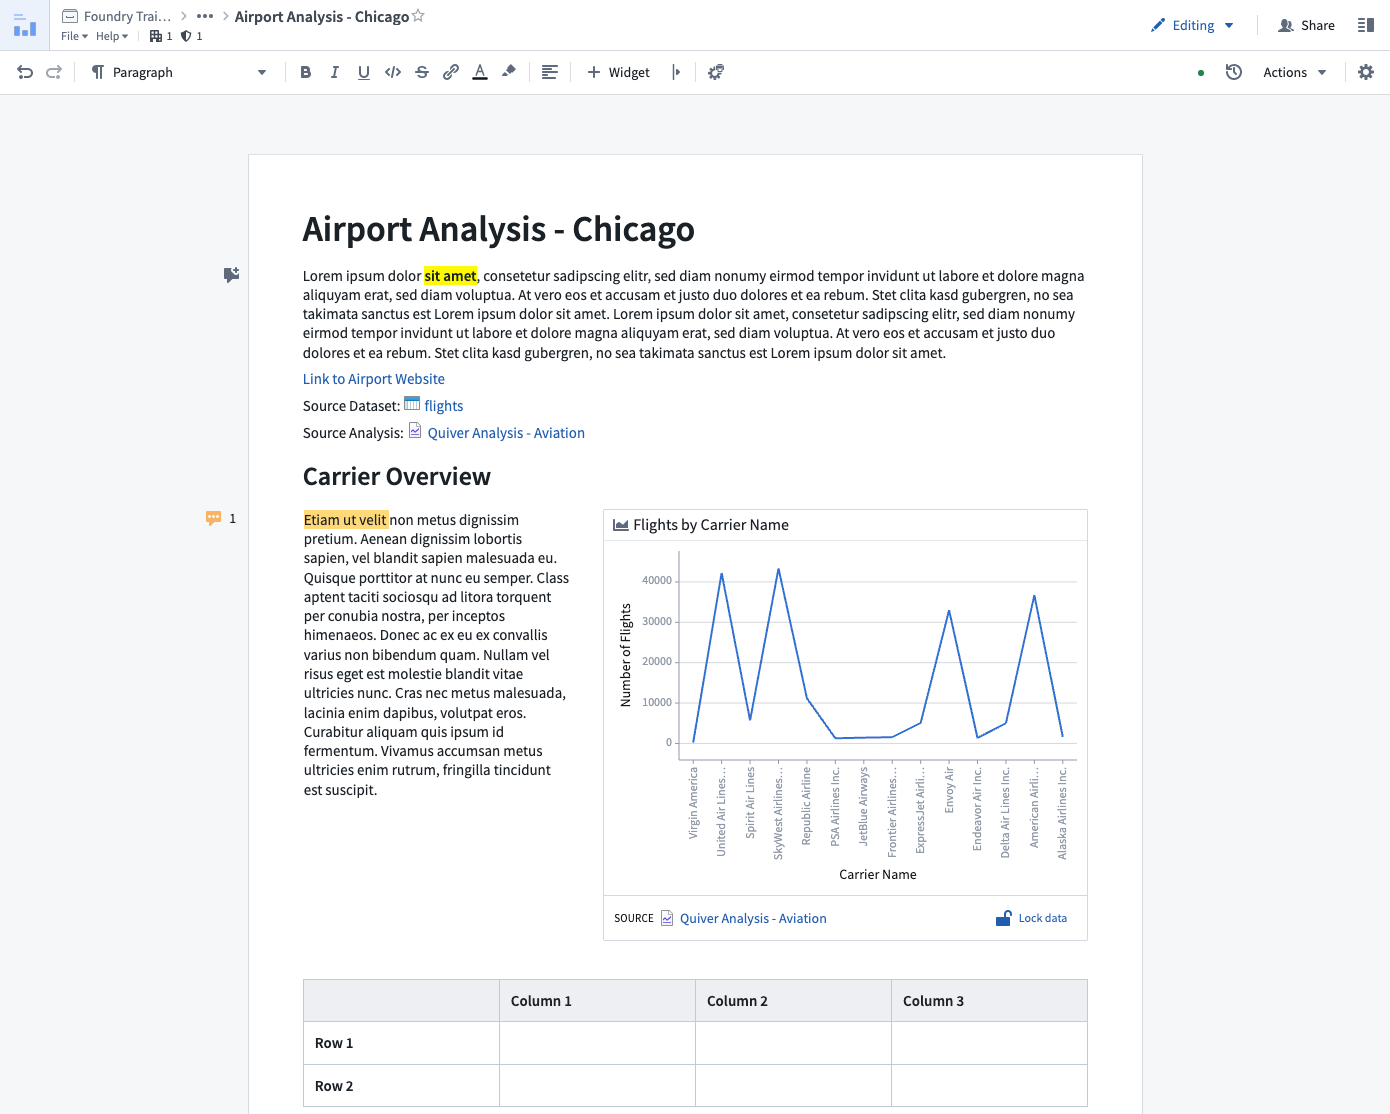
Many research projects in the Enclave are complex, involving multiple summary datasets, statistical analyses, and visualizations scattered across multiple applications and documents. Notepad is a tool that is often used for consolidating various research artifacts from multiple sources within the Enclave into a single coherent document as shown in Figure 8.15. Formatted Fusion tables, Contour charts, Python/R-generated images from Code Workbooks, and more are all embeddable in a Notepad document, with the option to add a title and caption for each artifact. Users can also create sections and provide narrative structure to their documents using Markdown. A Notepad document can be arranged and configured using a point-and-click interface.
All embedded objects can be configured to remain static or refresh automatically when the underlying data sources update. Notepad is also useful for annotating documents, presenting an executive summary of results for internal stakeholders, or external presentations after being approved for download request and export as PDF. A Logic Liaison Template in the Knowledge Store generally includes a README which is created using Notepad. The tool does have limitations in that it cannot be used to create dashboards that include chart-to-chart filtering; however, a Contour Dashboard can provide this feature for tabular data and a Quiver Dashboard can provide this feature for object or time series data. Palantir has curated documentation for creating and editing Notepad documents. Palantir also has documentation for their application known as Reports that was previously used in a similar fashion though with less functionality compared to Notepad.
8.4.7 Data Lineage (aka Monocle)
Foundry Documentation: Data Lineage Overview
- Find datasets
- Expand or hide a dataset’s ancestors and descendants
- Visualize a data pipeline and its details
- Facilitate dataset build scheduling
Whether you’re creating a data pipeline for your research project or investigating one from the Knowledge Store, you’ll likely want to holistically assess the dataset’s origins with the Data Lineage tool shown in Figure 8.16. The data pipeline flows from left to right, which is an intuitive way to visualize the relationships between datasets and their ancestors or descendants. Views are enhanced with color coding and grouping. The Data Lineage tool allows you to view details such as a dataset’s schema, last build datetime, and the code that generated the dataset. You can use this lineage tracing tool to understand and verify the data curation methods when using Knowledge Objects and other shared datasets as part of their study analysis. The Data Lineage tool also allows you to see upstream dataset(s) aka potential triggers and downstream dataset(s) aka potential targets for setting up dataset build schedules. Foundry Documentation provides additional instructions and descriptions of Data Lineage.
This chapter was first published May 2023. If you have suggested modifications or additions, please see How to Contribute on the book’s initial page.