
Chapter Leads: Peter Robinson, Justin Reese
This material for this chapter is mostly complete, and we’re adding the final touches before officially publishing it.
In the meantime, please enjoy this pre-release version.
If you have comments, please file a New Issue and tag Chris Roeder (GitHub username is @chrisroederucdenver).
12.1 Introduction
Machine learning (ML) is a method of teaching computers to learn a classification or regression function from data, or detect patterns (e.g., clusters) in data, without explicitly programming the model. Machine learning is a powerful tool for solving complex problems, and it is widely used in biomedicine and many other fields.
For biomedical applications, two main types of ML algorithms are generally used: supervised and unsupervised. In supervised learning, the labels (i.e., true classifications) for the input data used to train the model (e.g., which patients have a disease of interest, or develop an outcome of interest) are known. The goal of supervised learning is to learn a mapping function that can accurately predict the label for new, unseen input examples. A practical example of classification is reported in one of the first publications by the ML Domain Team, in which the aim was to classify COVID-patients based on their prognosis (2020).
In unsupervised ML, models are trained on input data without labels. In this case, the algorithm aims to discover structure within the data in order to facilitate the assignment of labels. One of the most widely known unsupervised ML techniques is clustering, which aims at partitioning the input cases into classes, where each class corresponds to similar cases according to a similarity/dissimilarity metric. In the clinical/medical field, clustering is often used to identify subtypes of a disease of interest. A practical example of clustering was also recently published by our ML group on the identification of long-COVID subtypes (2023).
The intention of this chapter is to demonstrate how to perform ML in N3C by walking the reader through a specific ML use case with working code.
12.2 Good Algorithmic Practice (GAP)
Knowledge of GAP is crucial to the successful application of machine learning to biomedical data. We intend to demonstrate GAP in this chapter by example. A full discussion of this is beyond the scope of this document, but a partial list of important considerations, with references for further reading, is as follows:
- Generalizability – models trained on one set of data often do not perform well on data originating from other places (e.g., other hospital systems) or other times (e.g., in a different period of time in the COVID pandemic) (2021). Since the goal of supervised machine learning is to develop generalizable algorithms that perform well on completely unseen (i.e., independent) test data, practitioners must be familiar with various techniques and considerations that mitigate the risk of failure to generalize (i.e., model overfitting) in the appropriate context, such as regularization, dimensionality reduction, feature extraction, cross-validation, and use of a model type that is appropriate given the amount of available data (e.g., deep learning algorithms may require relatively large training sets) Géron (2022). The machine learning practitioner should thoroughly understand the potential trade-off between under-fitting and over-fitting a predictive model (2009). In addition, N3C data is not a random sample, and it worth familiarizing yourself with the data as described in Chapters 7 and 3.
- Social bias – scientific literature abounds with ML models and results that contain bias with respect to factors such as gender, ethnicity, and race. It is critical to realize that the choice of data or ML model may reinforce harmful bias in scientific literature (2021). This can happen even if you do not intend to introduce such a bias.
- Data Considerations
- Site-Level Heterogeneity – N3C contains data from a large number of different hospital/healthcare systems (identified by the variable
data_parter_idin the N3Cpersontable) with several distinct common data models (ACT, OMOP, PCORNET, TRINETX). Features can vary wildly between data partners due to factors such as differing data models, patient populations, coding practices, and ETL code required for harmonization of data. This can negatively affect ML models, for example by limiting generalizability of models that depend on features that differ between sites (2020). It is thus helpful to understand the N3C data ingestion and harmonization processes described in Chapter 3. - Missingness – Your data will likely have missingness, sometimes quite often. How you deal with this can greatly affect your ML results. (2023) See also Casiraghi, et al.(2023) for a detailed description of missingness specifically in N3C, and strategies for dealing with it, such as imputation. Ultimately, how you deal with missingness is subject to how reasonable your assumptions are concerning relationships between observed data and desired-yet-missing information, assumptions best guided by engaging with subject matter experts familiar with the data relationships at hand (see below).
- Features for ML – In the example use case we describe here, we will leverage the N3C Logic Liaison COVID-19 Diagnosed or Lab Confirmed Patients fact table as a source of features. If this table does not contain the data you need for your ML task, you can explore other available datasets or use the Logic Liaison templates to construct additional derived variables, or create your own custom derived variables. Appropriate data pre-processing, feature selection and/or feature engineering is a crucial step in the machine learning process. Depending upon the type of algorithm, data may also need to be normalized to reduce the risk of excessive influence of features in certain classifiers (2014; 2020).
- Site-Level Heterogeneity – N3C contains data from a large number of different hospital/healthcare systems (identified by the variable
- Engaging with subject matter experts – Your ML project will greatly benefit from subject matter experts to guide your experimental design and to help interpret your results. If you are performing ML on data from people with, for example, diabetes, you should engage at least one clinical diabetes expert with whom you can collaborate. One of the strengths of N3C is the large and diverse community of scientists, and it is likely that there is an expert in almost any field of interest who can help. Subject matter experts can provide important help in feature selection, assessments of windows for variables, choice of feature transformations and interaction terms in a model, and definition of model performance goals (sensitivity versus specificity trade-off). N3C Domain Teams are an excellent source of such expertise, as many are organized around clinical topics such as Diabetes, Kidney Injury, Pregnancy, and many more.
- Explainability – Of great interest to practitioners is the explainability of machine learning models, as deep learning tools that rely upon progressive abstractions of data in hidden layers may seem like “black boxes,” especially to those who are not versed in machine learning. Tools are available to help assess feature importance (e.g., SHAP values (2018) (1953)
- Adequate Documentation – Clearly annotated code, with explicit characterization of methodology and techniques that are employed, as well as descriptions of all key steps in a pipeline, including hyperparameter choice/search, appropriate train/test splits, etc., are critical to reproducibility of research. In addition, The N3C Enclave provides a feature called Protocol Pad which can explain exactly how a study was conducted in N3C.
12.3 ML in N3C
Developing ML pipelines in the N3C platform is similar to developing code to solve other tasks, e.g., statistical analyses. The main challenges involve preparing the data to form cohorts, selecting features, and understanding how to develop your code.
12.3.1 Languages and libraries available in N3C
ML in N3C is typically performed using Python or R. Pipelines are also sometimes mixed-language (R, Python, SQL, Java). Most major ML libraries in Python and R are already installed and additional libraries can be made available on a project-specific basis. The examples in this chapter will use Python. For long-running and memory-intensive machine learning jobs, pyspark provides the library pyspark.ml.
12.3.1.1 What you should know before reading this chapter:
- Understanding of GAP (see GAP section above)
- Basic proficiency in software development
- Basic proficiency in Python (see Python.org website for some references on learning Python)
- Basic knowledge of ML (see Hands–on Machine Learning with Scikit–Learn, Keras, and TensorFlow for a good reference)
- Basic knowledge of EHR data, especially data that follows the OMOP common data model (see the Book of OHDSI for a good reference)
- Basic familiarity with code repositories (see Code Repositories for N3C documentation)
- Basic familiarity with code workbooks (see Code Workbooks for N3C documentation)
12.3.2 Example project
To demonstrate how to implement ML software in N3C, we will walk through a specific example: predicting cardiovascular sequelae (specifically, atrial fibrillation/flutter) from acute COVID.
12.3.2.1 Strategy
- Create a reusable ML library package. This library contains the implementations of standard machine learning classification algorithms such as logistic regression, naïve Bayes, random forest, support vector machine, and multi-layer perceptron. This package can be imported and used for any downstream classification applications.
- Define cohort and features using the N3C Logic Liaison COVID-19 Diagnosed or Lab Confirmed Patients fact table (See also Chapter 8.) This table provides many variables (including records for COVID-associated conditions such as diabetes or acute kidney injury by the timing of each: before, during and after acute COVID-19 infection) for each patient and is useful for ML tasks.
- Choose one post-COVID indicator column as a label to predict. Here we will predict cardiovascular sequelae following acute COVID. In this example, we will use ‘Atrial Fibrillation Flutter (AFF)’ post COVID-19 as an indicator for cardiovascular sequelae.
- Predict this label using a single ML model. We will use the random forest model from the ML library created in step 1 to predict AFF post COVID. One can use as an alternative any of the classification models available in the library.
12.3.2.2 Walkthrough:
We implemented the above strategy using code repositories. Code repositories greatly facilitate software development in the Enclave. Useful features include a debugger, a GitHub-like workflow (pull requests, branches, diffs, etc.) to coordinate among developers, and a convenient method to export code to GitHub. In addition, the process for specifying Python packages to be used is much more convenient, and (in the authors’ experience) code repositories are also more stable and less prone to runtime issues than code workbooks. Two notable limitations of code repositories should be noted:
- Plots/visualization must be done separately in a code workbook (as in step 3 below) and
- The R language is not supported in code repositories as of July 2023, so performing statistical analyses with R packages also requires a code workbook.
For our walkthrough, we will be creating and using a Python library repository ml-classification-pipeline Python library and a data transform code repository that Blessy Antony (Virginia Tech, blessyantony@vt.edu) developed to do machine learning in N3C.
For the basics of creating a code repository and using its debugger, see Chapter 8.
Reusable ML library package
Create a folder in a workspace. Go to your DUR workspace or “Practice Area - Public and Example Data” Left sidebar → Search → “Practice Area - Public and Example Data” → click on first hit → make a new folder
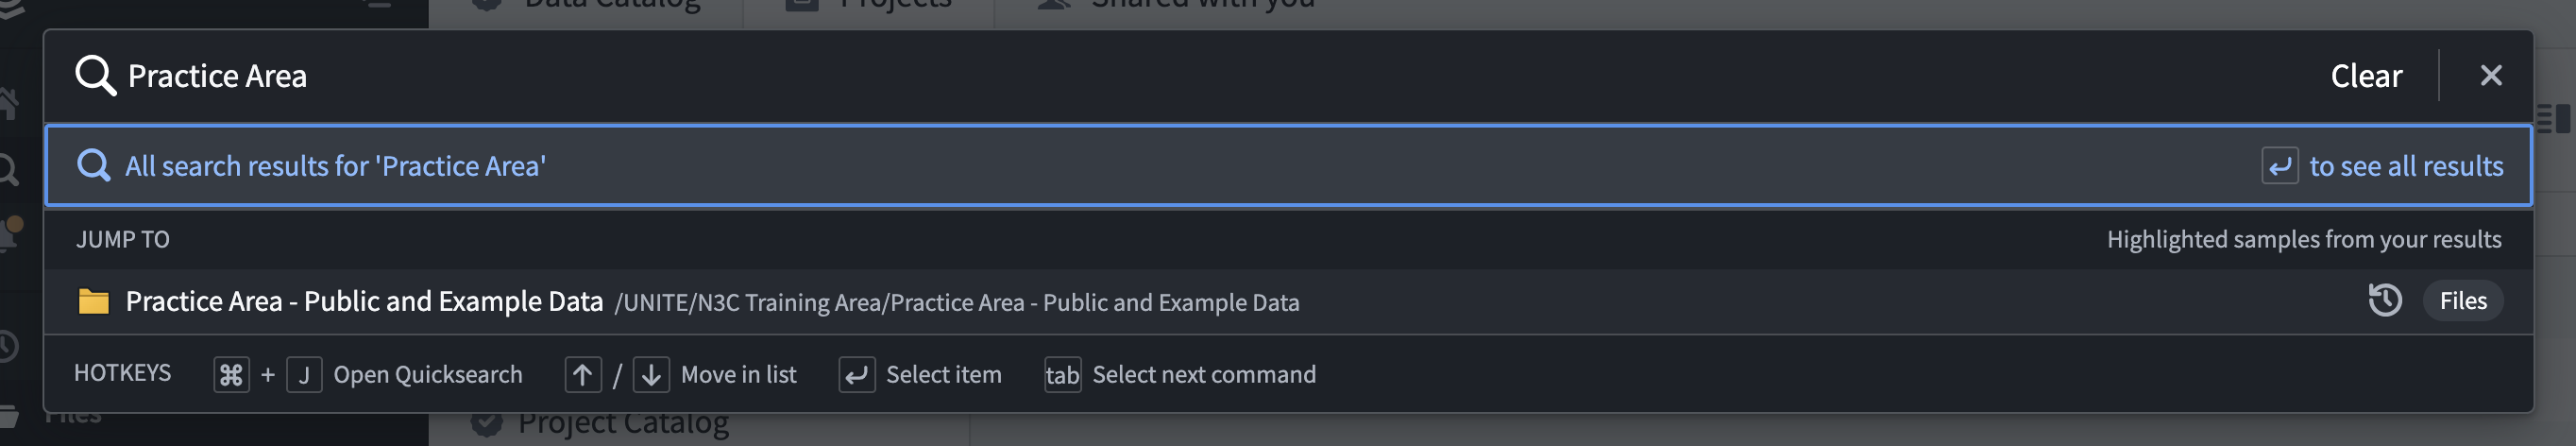
Figure 12.1: Create a folder in your workspace of choice (private DUR or public practice area) where all your code will be located. Create a Python library code repository to implement the ML algorithms. New → code repository → Python Library → initialize repository
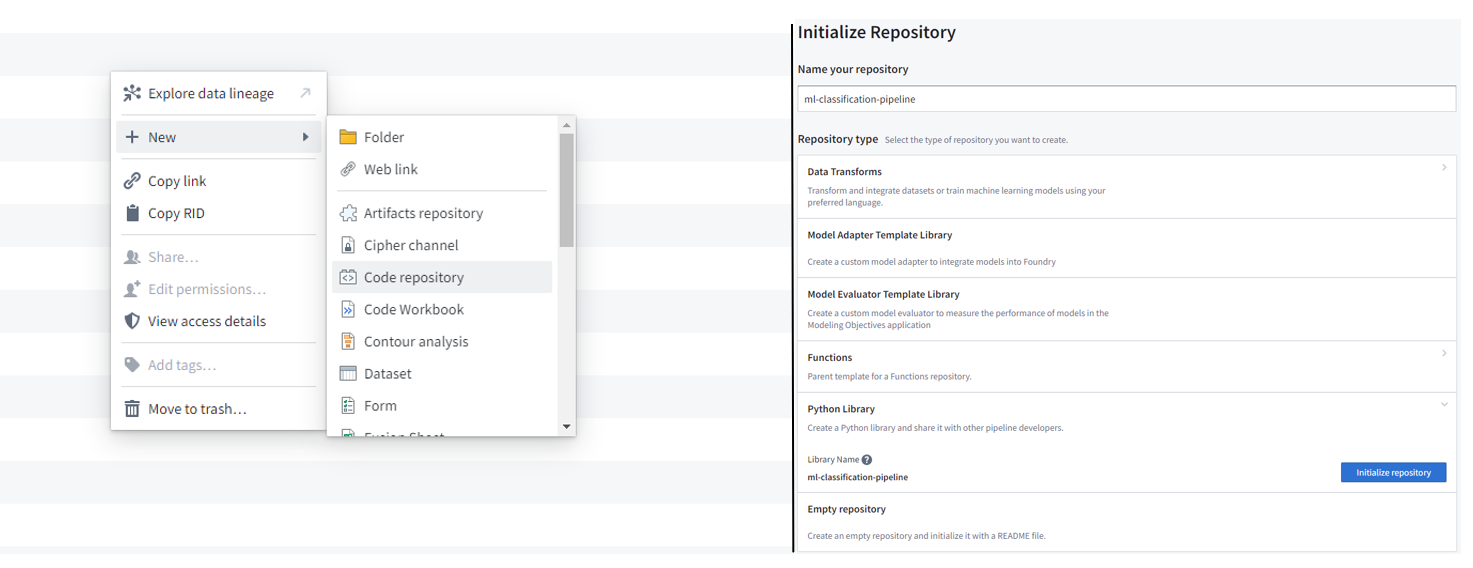
Figure 12.2: Create a python library code repository that will contain all reusable code to be later used in other downstream code repositories. This repository provides two frameworks that implement logistic regression, random forest, support vector machine, and multi-layer perceptron - scikit-learn and pyspark.ml at ml-classification-pipeline/src/models/.
Adding dependencies to code repository – See the N3C documentation on discovering and using Python libraries in code repositories.
Implementation of classification algorithms – The scikit-learn and pyspark implementations have the following code organization -
dataset_preprocessor.py – Methods to drop column(s) from the input dataset, split the dataset into training and test datasets based on a given ratio, sample the training and/or testing datasets to have approximately equal number of positive and negative samples (if required), standardize the datasets.
The pyspark implementation contains an additional method to assemble the input into libsvm format.
classification_model.py – The ClassificationModel class implements a classification pipeline. First, preprocess the dataset and compute training and testing datasets using the methods in dataset_preprocessor.py. Second, perform hyperparameter search and train classification models using k-fold cross validation. Third, evaluate the trained models on test datasets. Finally, perform multiple iterations of these three steps to generalize the results.
classification algorithms – The logistic_regression.py, multi_layer_perceptron.py, random_forest.py, and svm.py files implement the respective classification algorithms with model instantiation and definition of the hyperparameter search. The classes defined in each of these files extend the ClassificationModel class defined in classification_model.py and leverage the pipeline implemented in the parent class.
Post COVID cardiovascular sequelae prediction
Create a Python transforms code repository. Go to the folder that you had created in step 1a and create a new python transforms code repository - New → code repository → Data transforms (Python) → initialize repository:
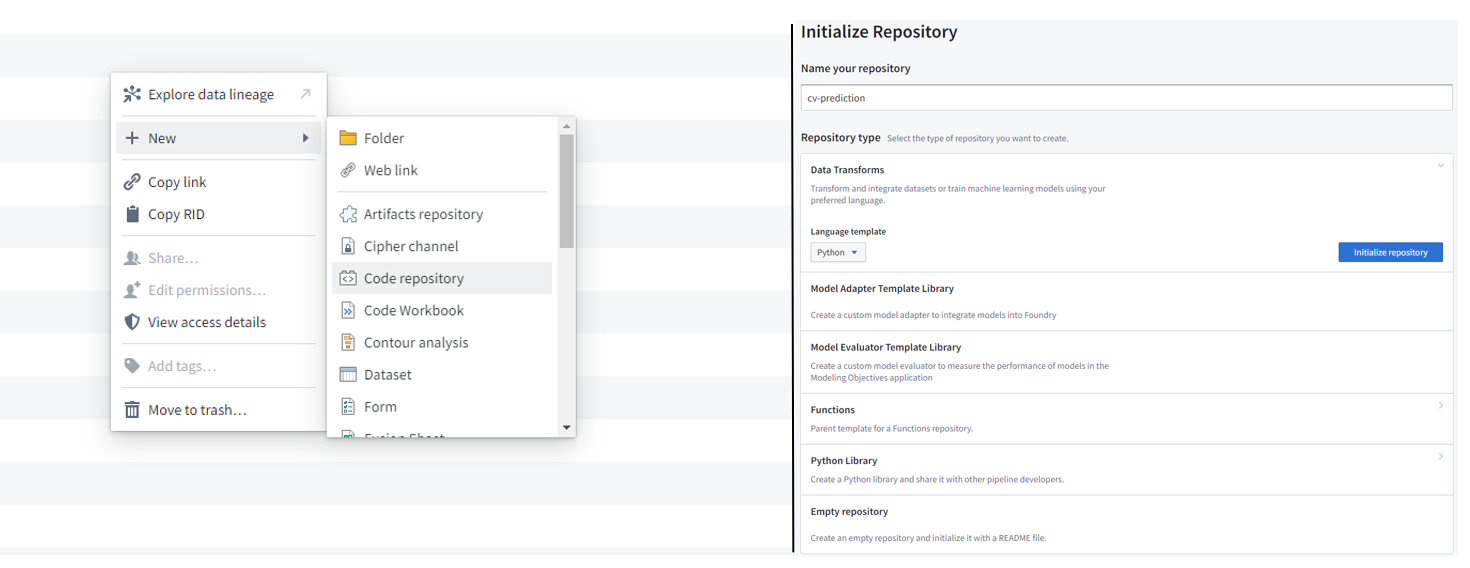
Figure 12.3: Create a python data transforms code repository for cardiovascular sequelae prediction that will use the library created in step 1. Define cohort and features using COVID patient facts table. Create a new transform called “aff_create_cohort.py” Left sidebar → select folder where you want to create the file → right click → New File → Enter filename → Select ‘Python Transformation (*.py)’ from the drop down → Create
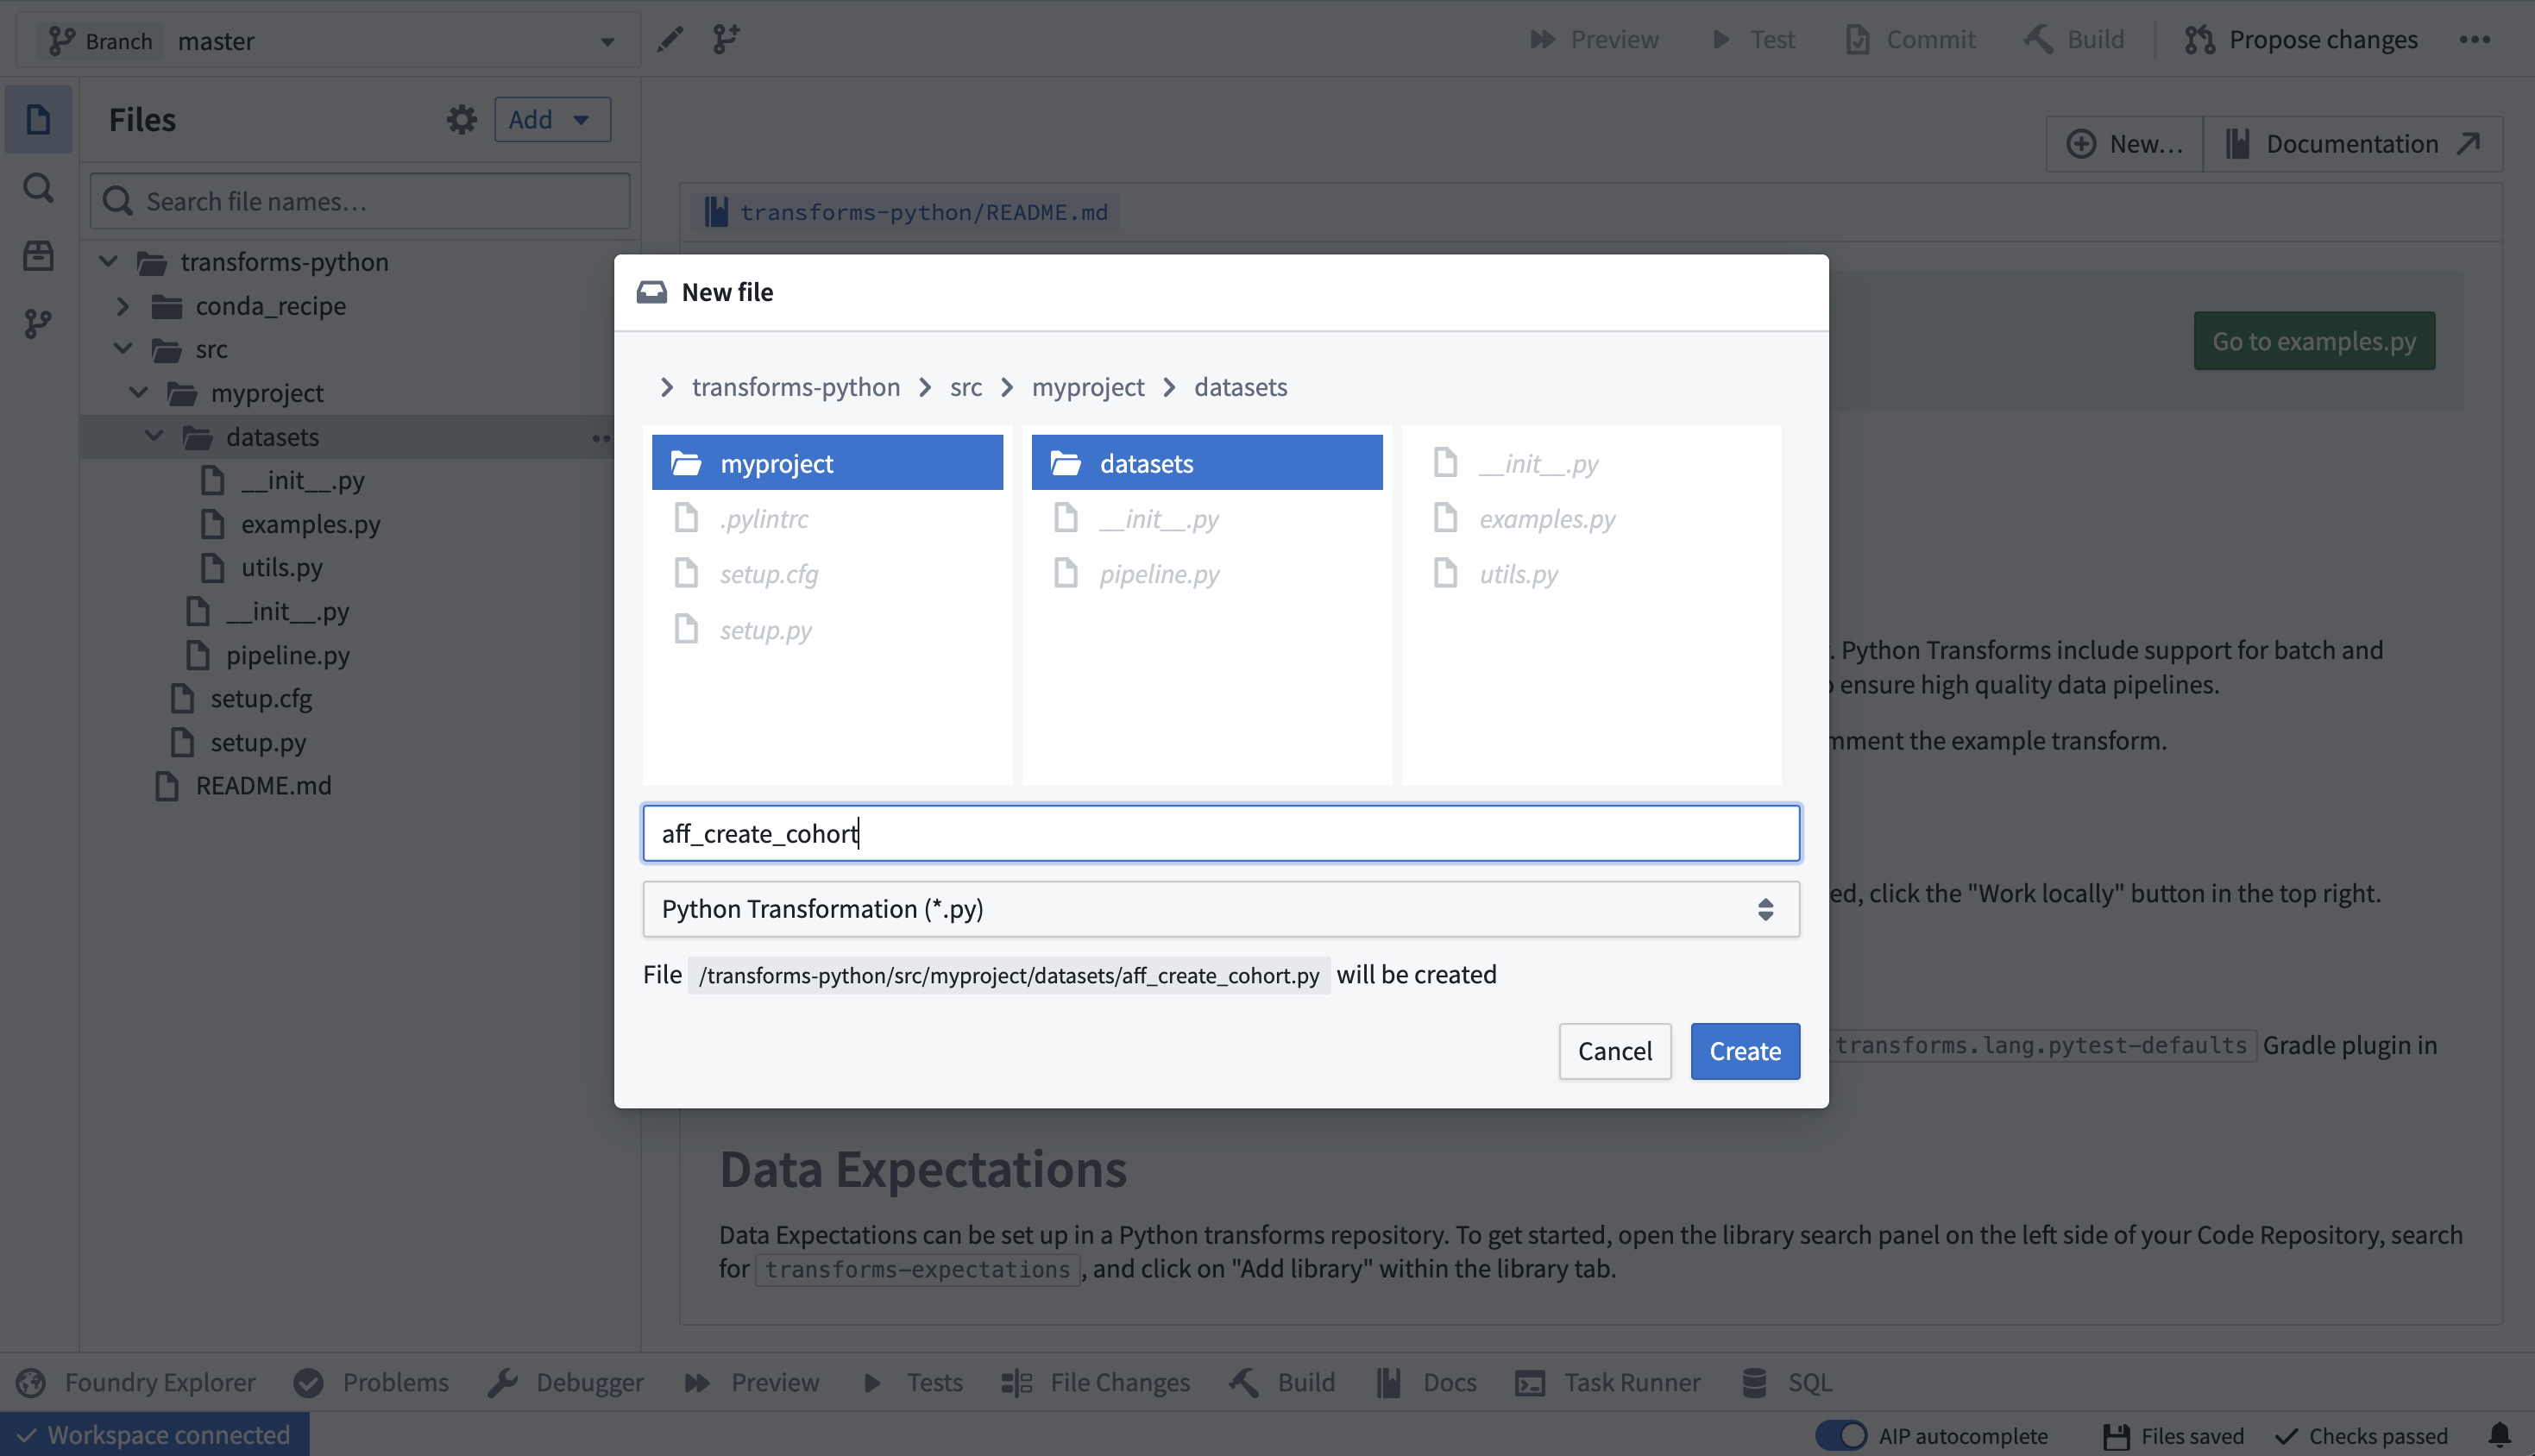
Figure 12.4: Create a new python transformation script file within a code repository. We’ve created a code repository, now we can create a transform to build a random forest model using the ml-classification-pipeline library (note that this library can also be used in code workbooks):
Add the ml-classification-pipeline library. We’ve created a code repository, now we can create a transform to build a random forest model using the ml-classification-pipeline library (note that this library can also be used in code workbooks). First, we need to add the library, by navigating to the Sidebar -> Libraries -> search for ml-classification-pipeline.
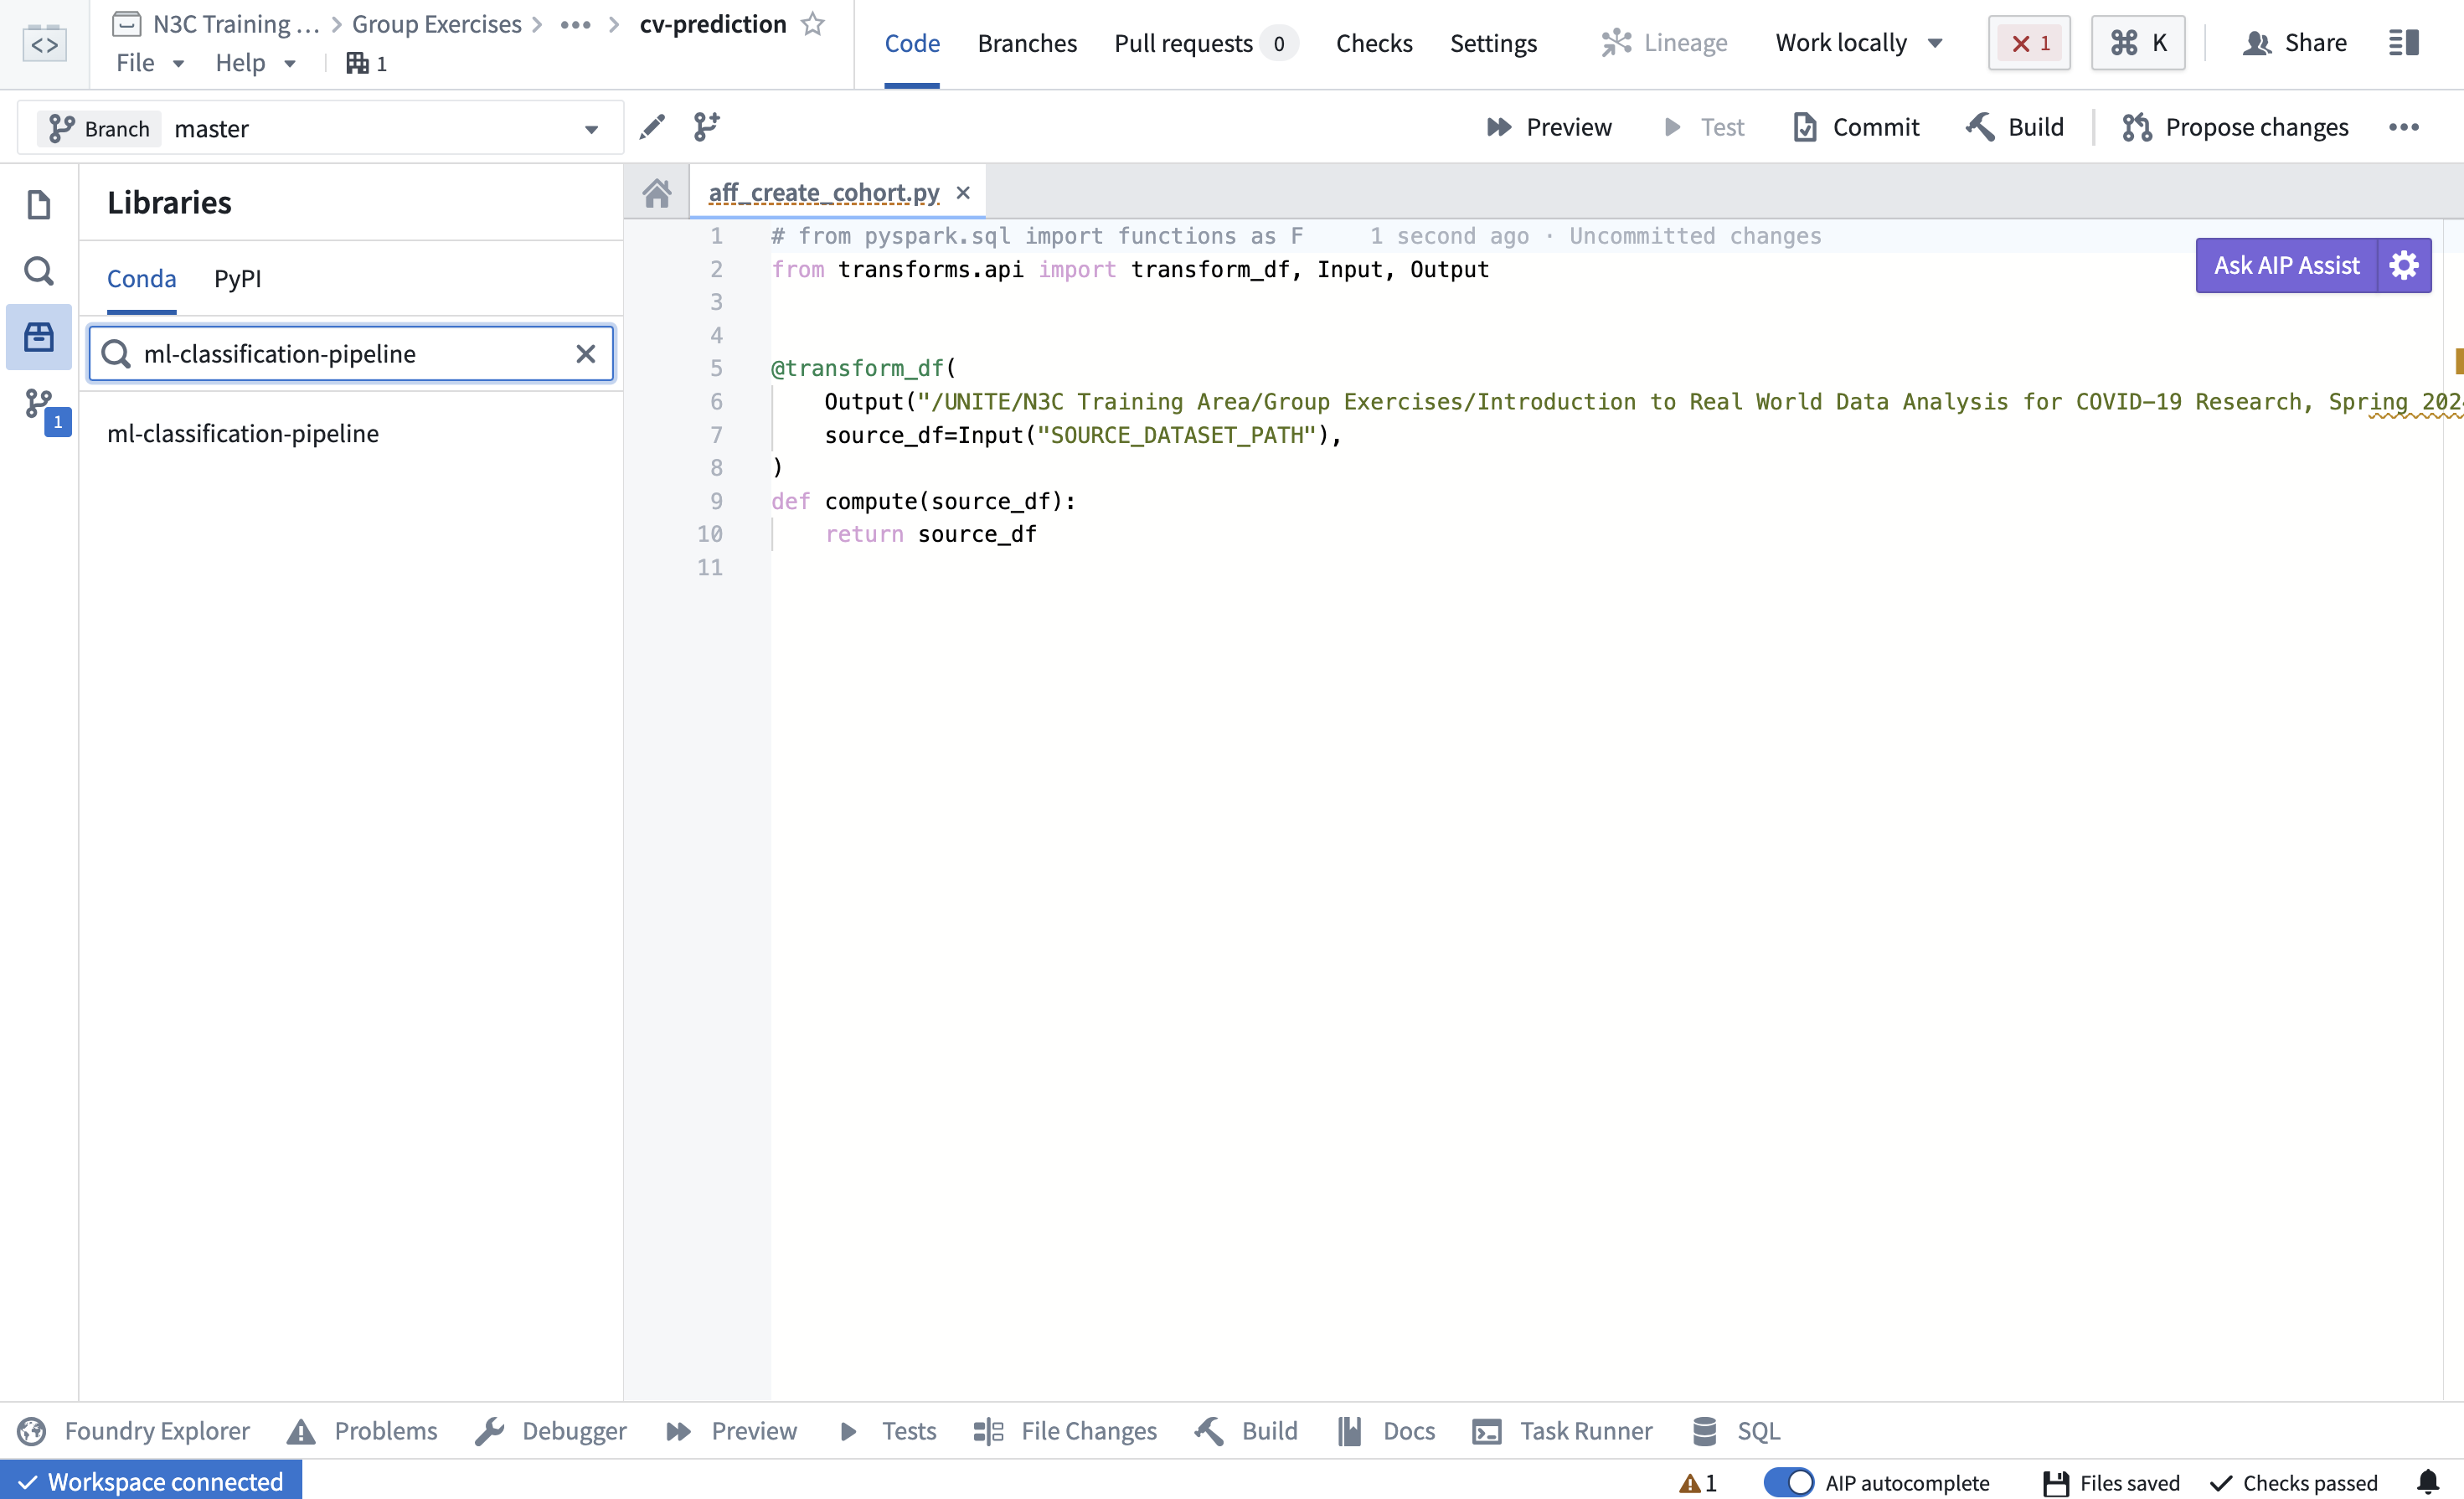
Figure 12.5: Search for a custom-created python library in the code repository.
Next, add the library by clicking “Add and install library”: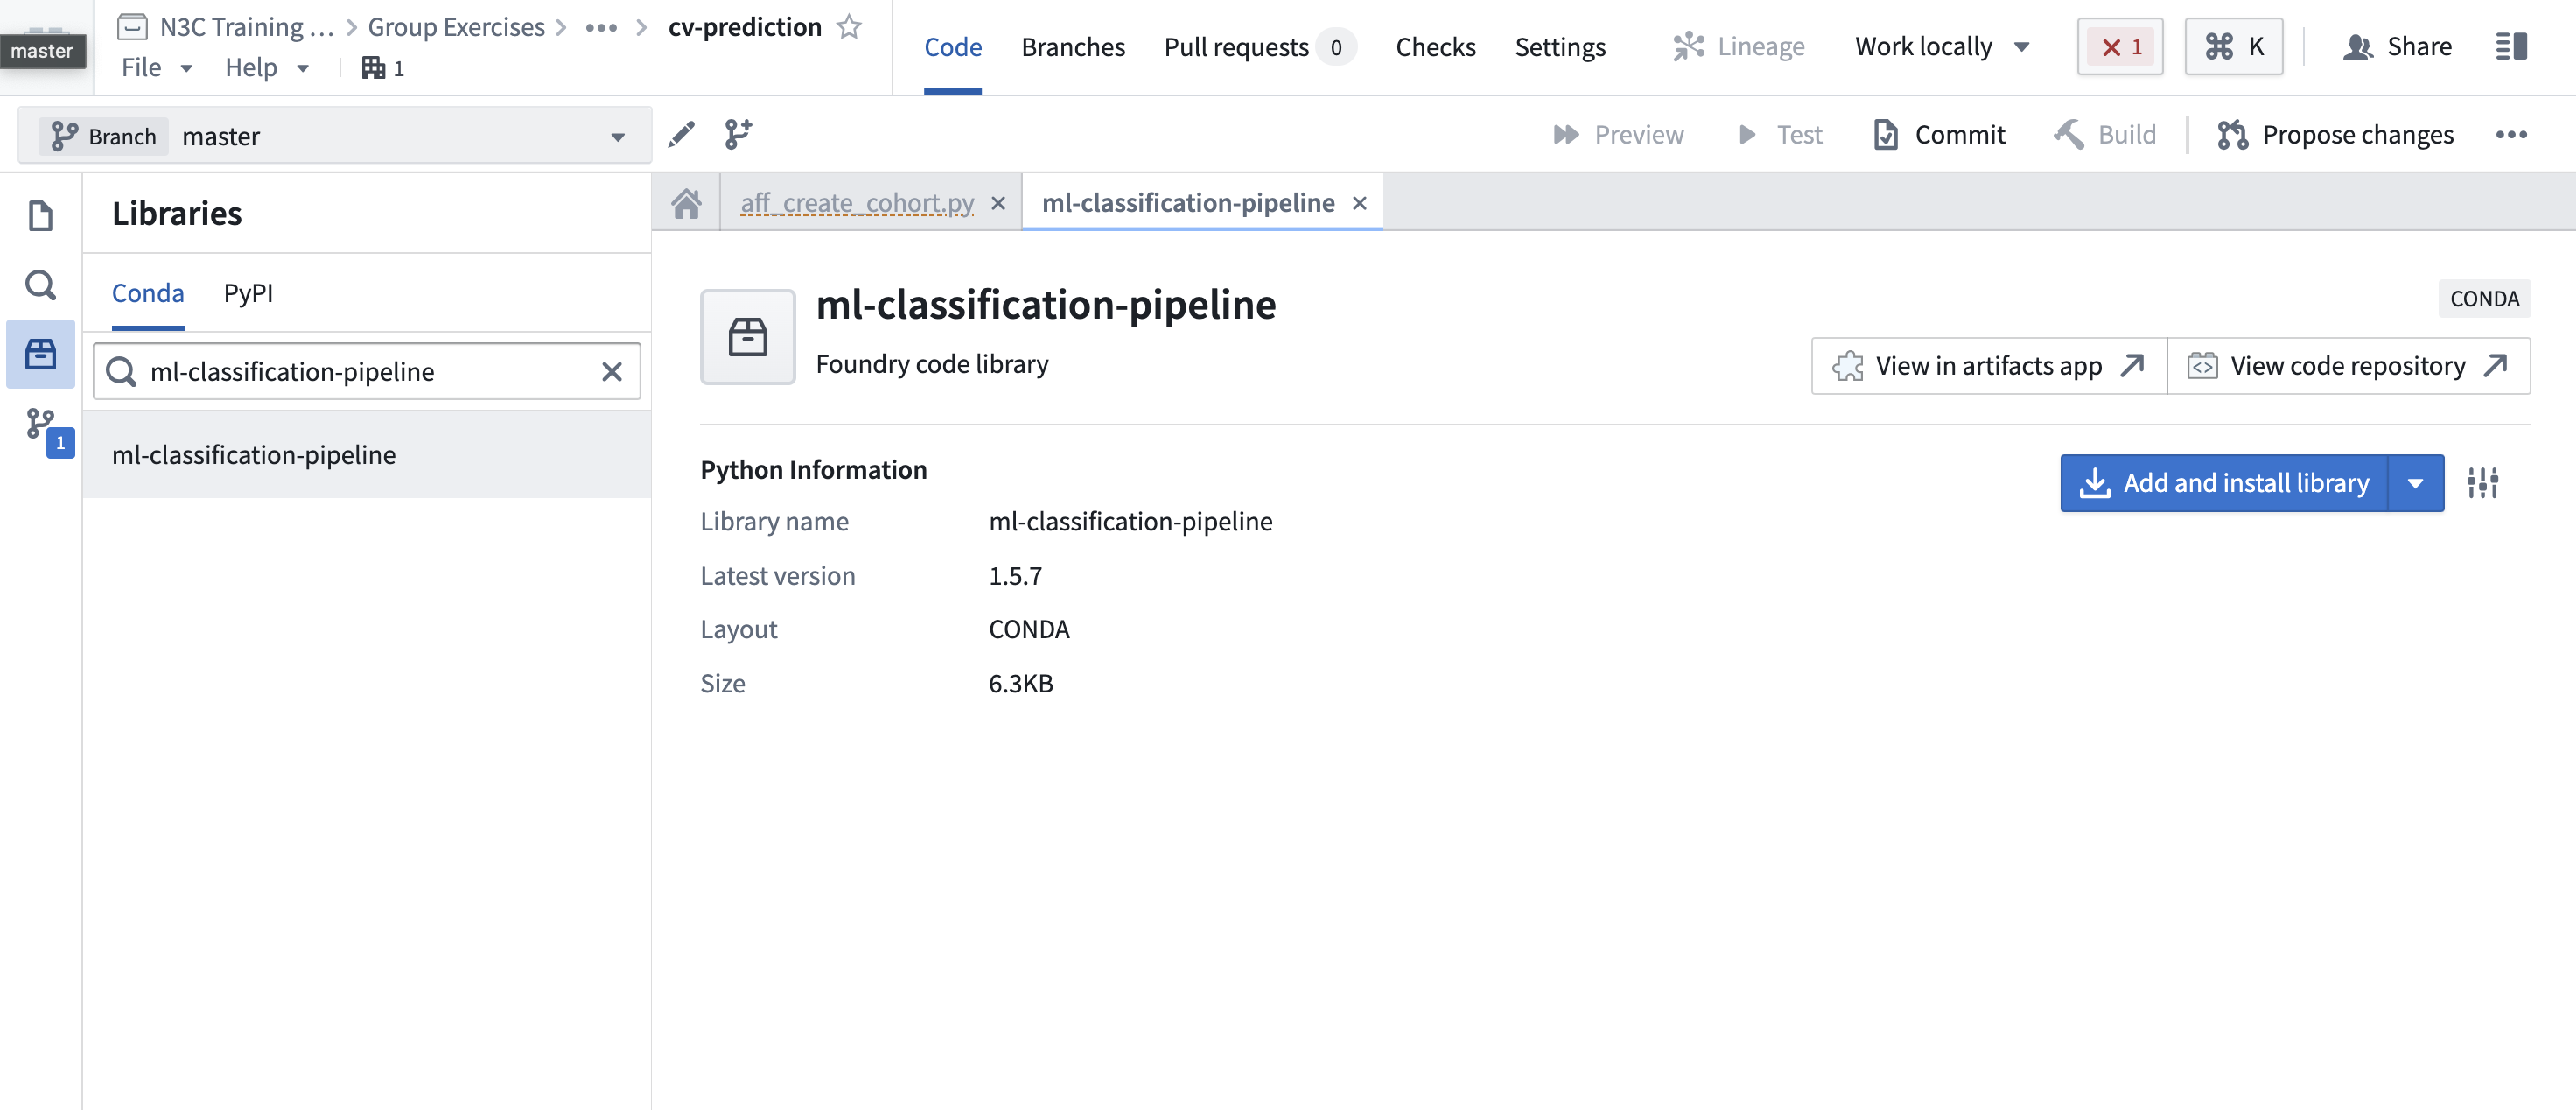
Figure 12.6: Add a custom-created python library in the code repository.
NOTE: An error message similar to the one below is sometimes encountered during this step. N3C support may be necessary to resolve this error, see Chapter 11.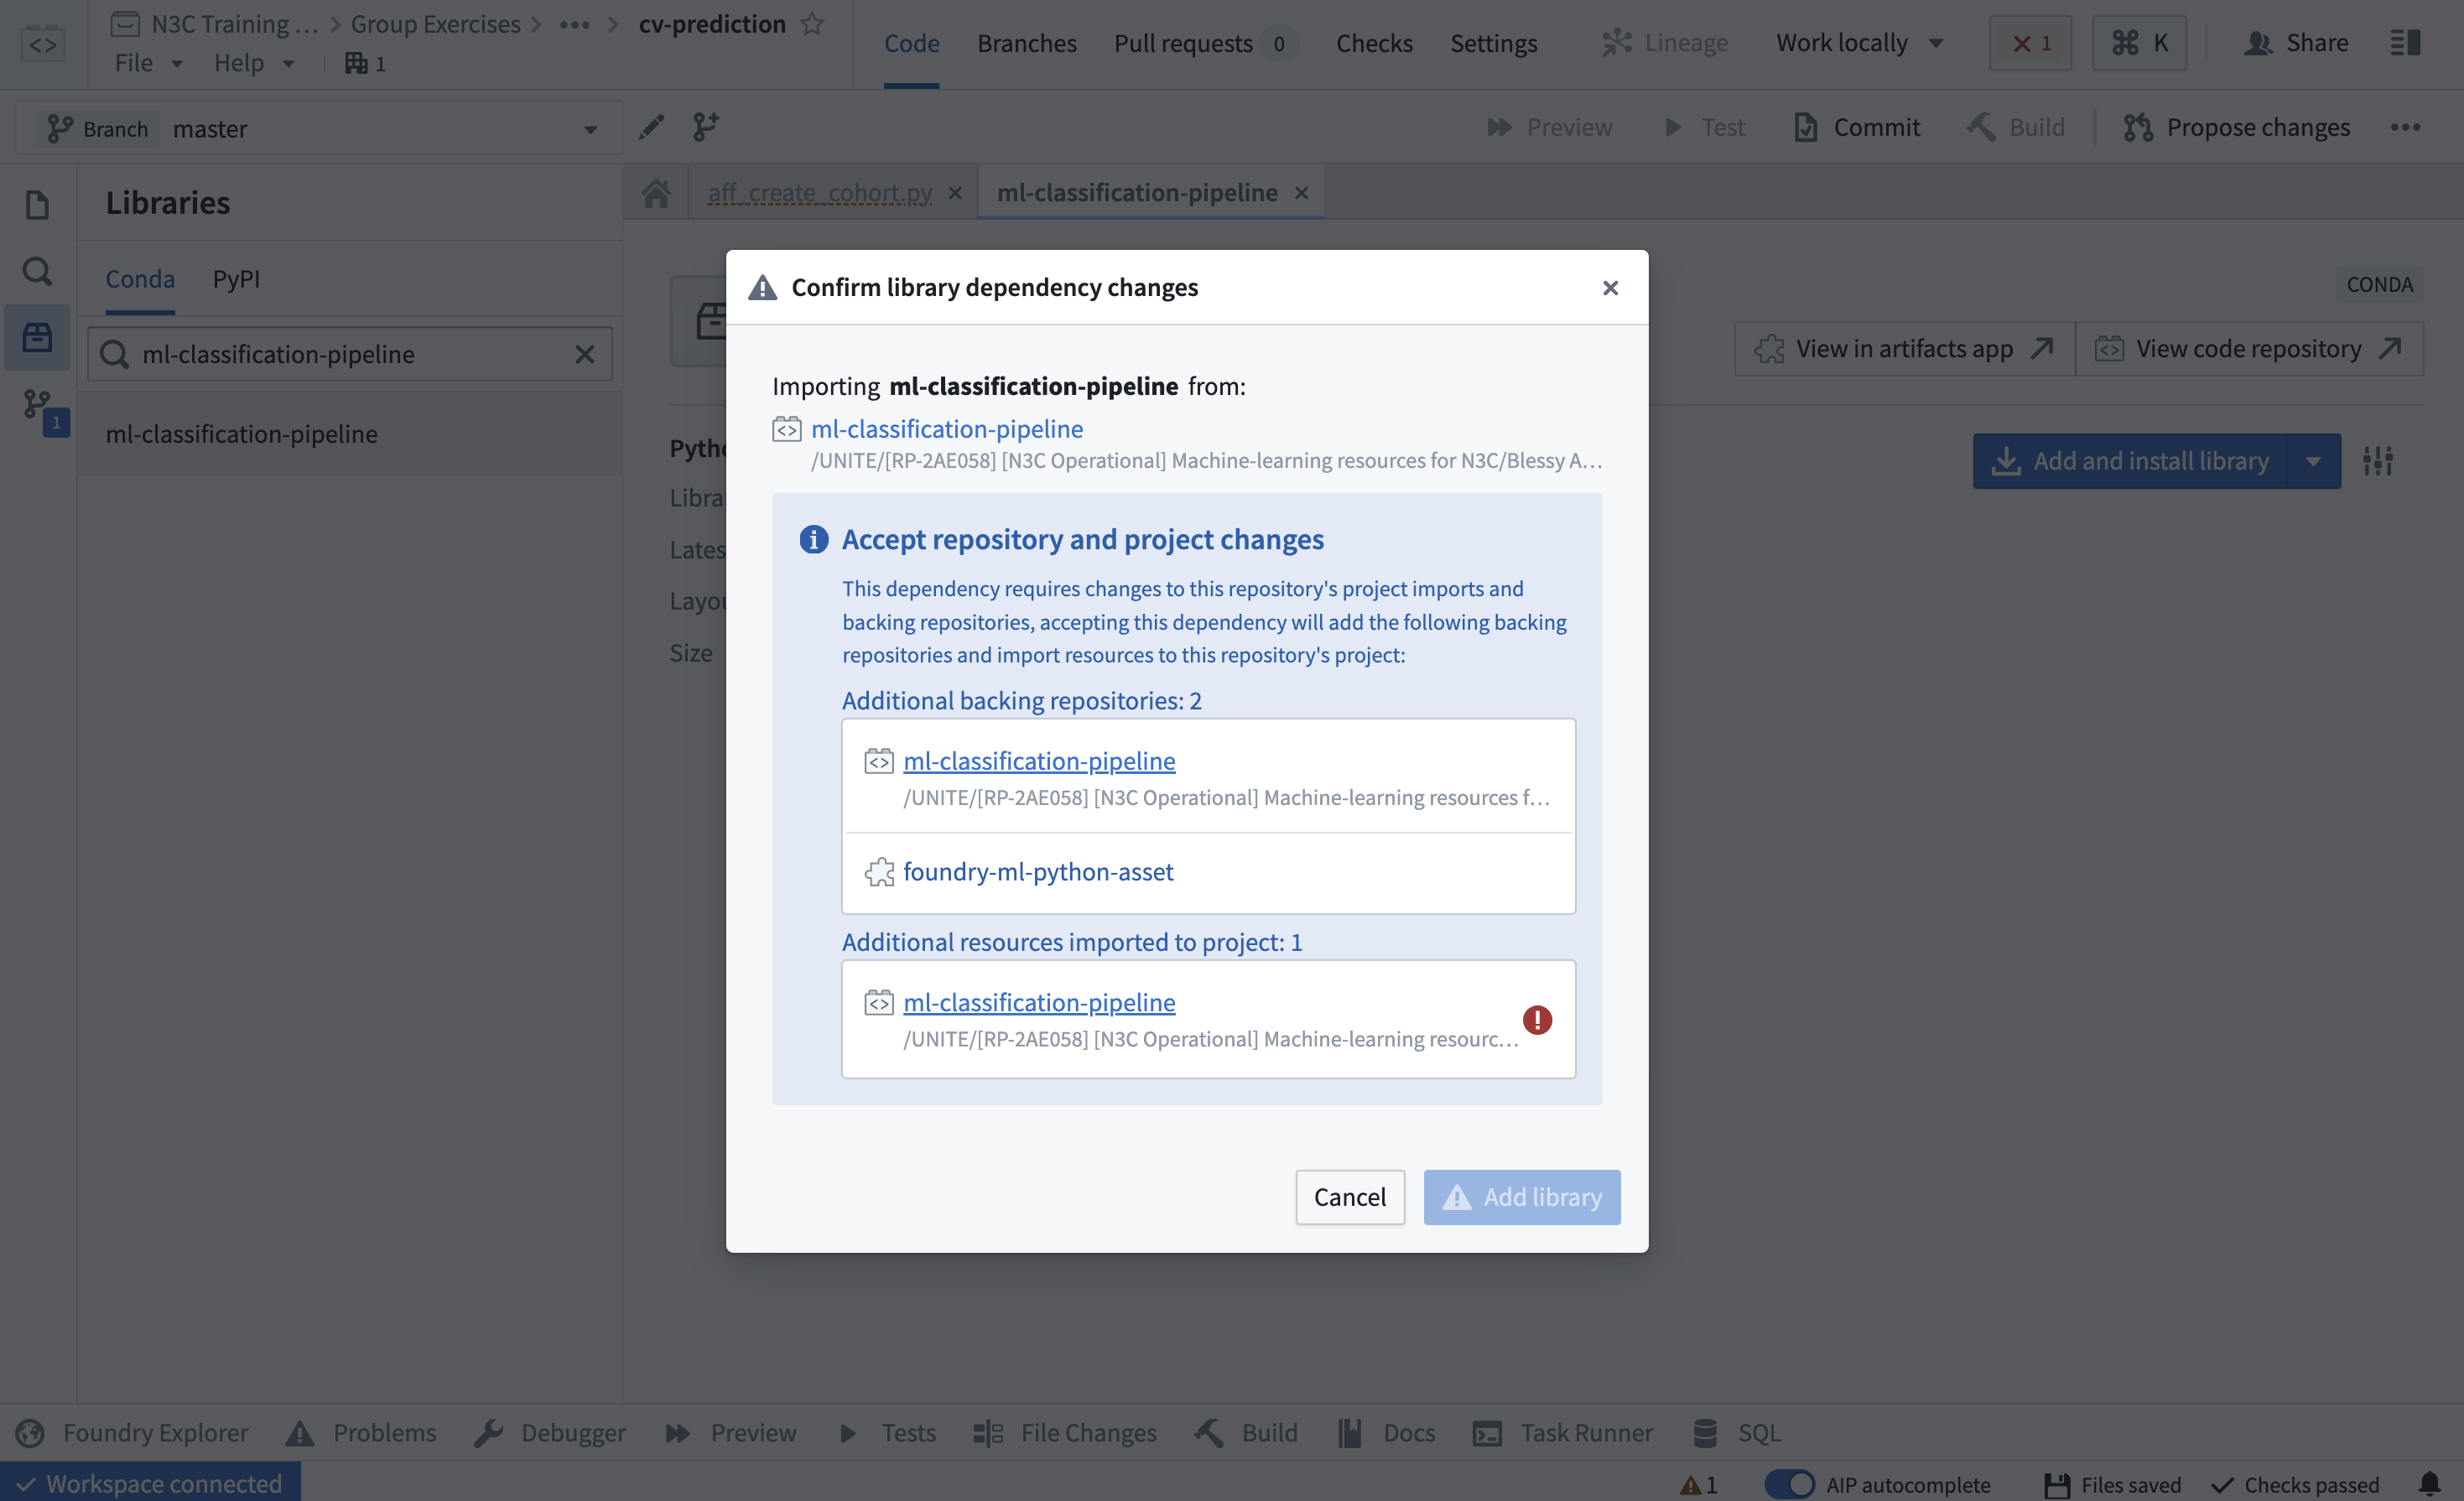
Figure 12.7: Access error while adding custom-created libraries in code repositories. N3C support may be necessary to resolve this error.
Next, go back to the ‘files’ tab on the left sidebar, and commit your changes.Implement a random forest model for the prediction task. Create a new transform that trains a random forest on this cohort:
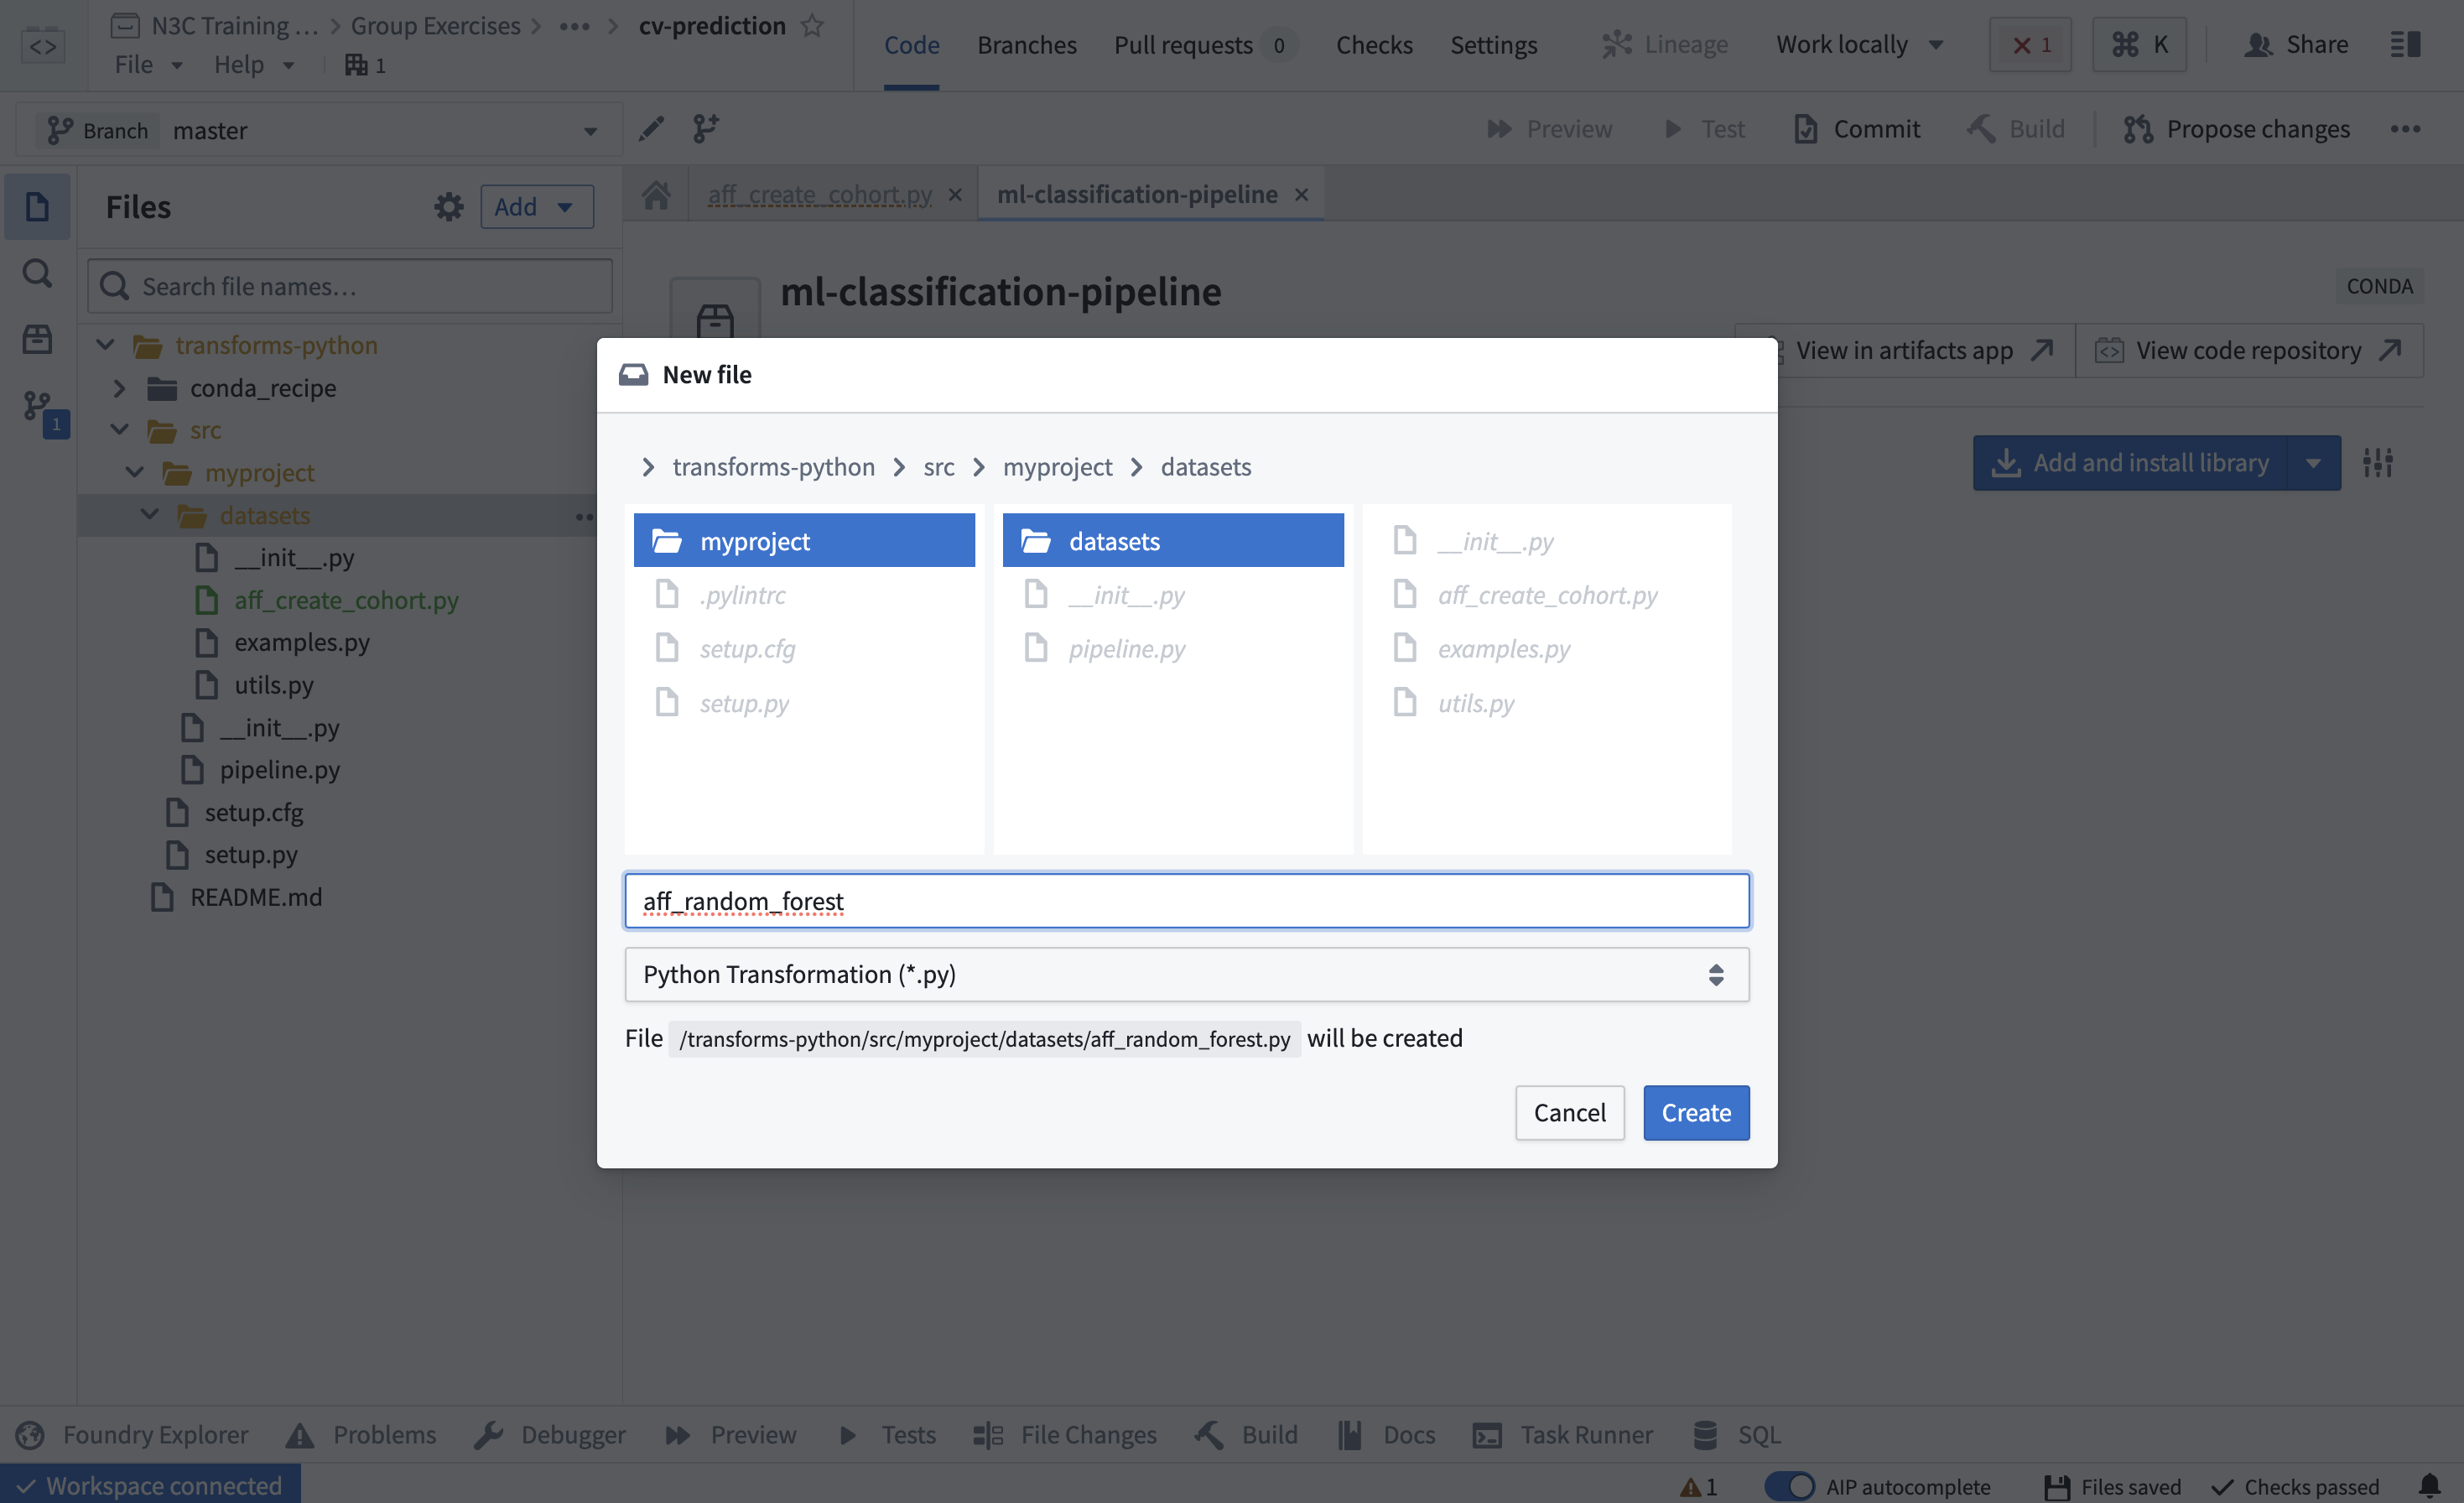
Figure 12.8: Create python script file. Now some code - this uses the output of
aff_create_cohort.pyas input, and runs a random forest on it. You’ll need to change this line to be a path to somewhere you can write a dataset:allpatients_output=Output("PATH_TO_YOUR_OUTPUT_DATASET"),And change this line to the path or the Resource Identifier (RID) of the dataset you saved above in
aff_create_cohort.py:allpatients_df=Input("PUT IN PATH OR RID FOR OUTPUT OF aff_create_cohort.py"), from transforms.api import transform, configure, Input, Output from models.sklearn import random_forest @configure(profile=['DRIVER_MEMORY_EXTRA_LARGE']) @transform( allpatients_output=Output("PATH_TO_YOUR_OUTPUT_DATASET"), allpatients_df=Input("PUT IN PATH OR RID FOR OUTPUT OF aff_create_cohort.py"), ) def compute(allpatients_df, allpatients_output): n_iterations = 5 train_test_ratio = [0.8, 0.2] preprocess_exclude_columns = ["COVID_associated_hospitalization_indicator", "COVID_index_date"] standardize_exclude_columns = ["person_id", "label"] allpatients_df = allpatients_df.dataframe() allpatients_output.write_dataframe(run(allpatients_df, n_iterations, train_test_ratio, preprocess_exclude_columns, standardize_exclude_columns)) def run(dataset, n_iterations, train_test_ratio, preprocess_exclude_columns, standardize_exclude_columns): random_forest_model = random_forest.RandomForestModel(dataset, n_iterations, train_test_ratio, preprocess_exclude_columns, standardize_exclude_columns) return random_forest_model.run()
Visualize the results. Code repositories do not support creating and viewing visualizations. Hence, we will use code workbooks to create visualizations.
Create a code workbook. Navigate to the folder location where you want to create the code workbook → Right Click → New →Code Workbook.
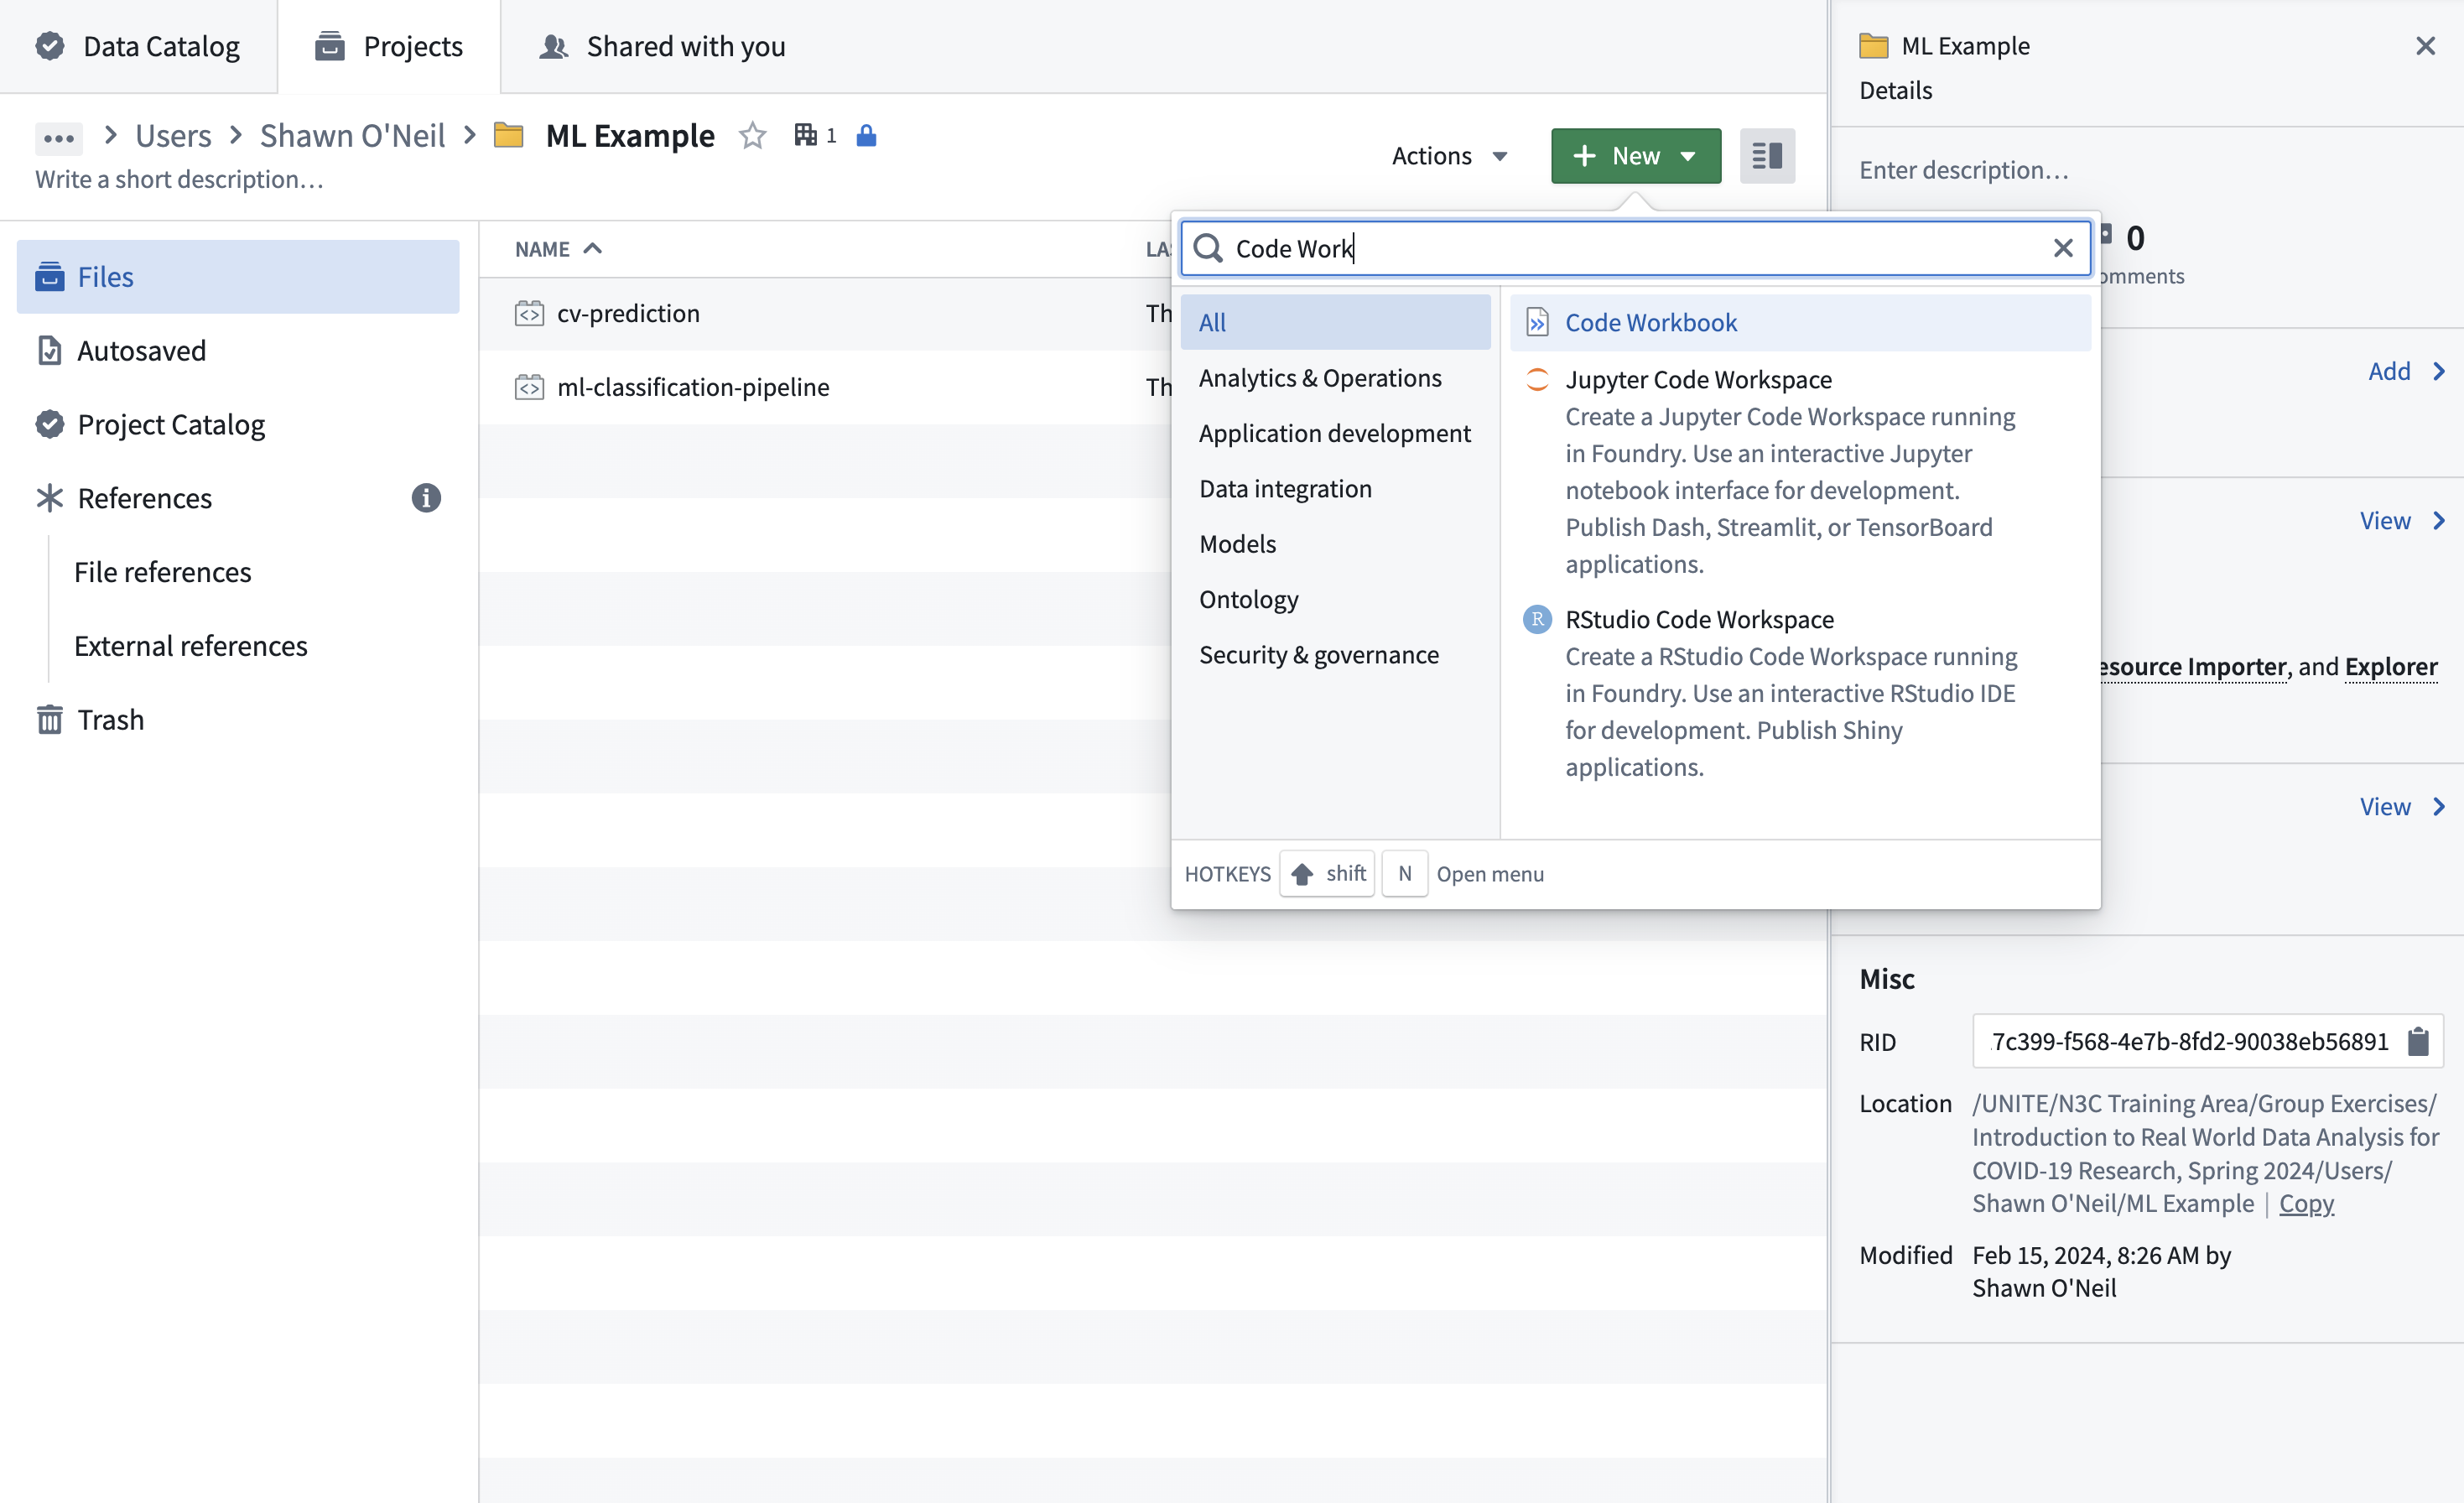
Figure 12.9: Create a new code workbook. Additional details about the usage, customization, and features of Code Workbooks are discussed in Chapter 8.
Compute metrics to evaluate prediction models. Create a new Python transform node: New transform(top left) → Python code The name of the node is the name of the function to be implemented within the node and it is also the name of the output dataset generated by this node.
Nodes are the atomic units of a code workbook in which we implement individual functions.
Each function takes in one or more input datasets and produces one output dataset. We can import datasets into code workbooks. When the output of a node is provided as an input to another node within the same code workbook, a dependency edge is established from the former to the latter node.
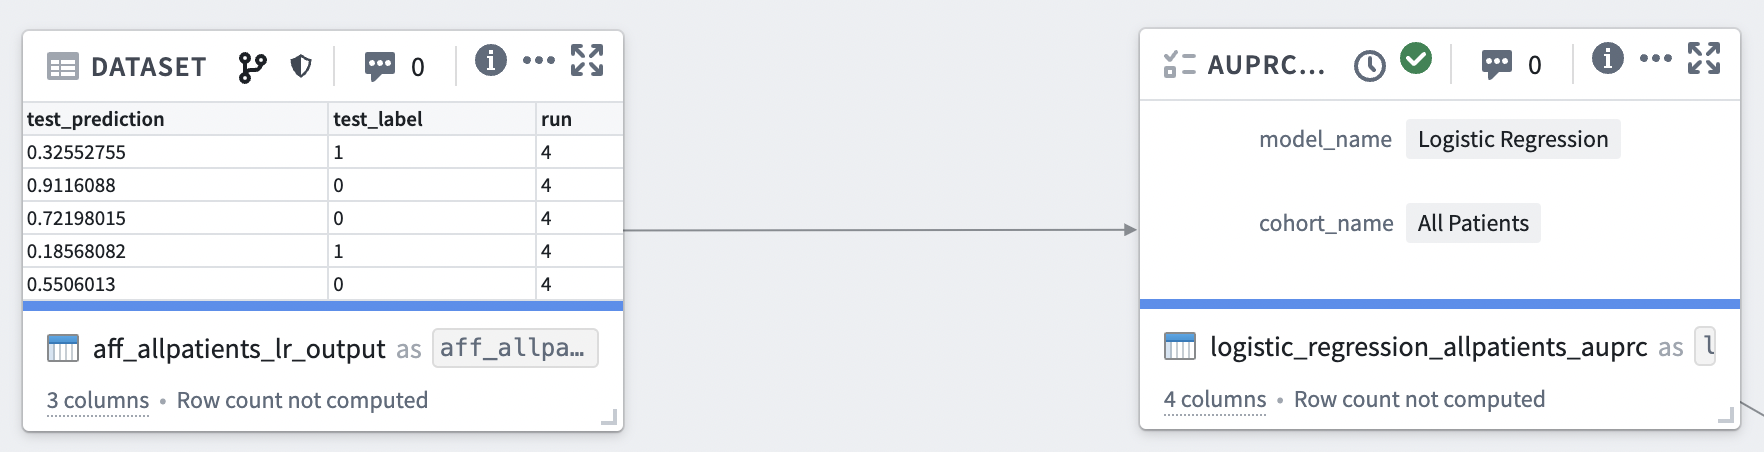
Figure 12.10: Referencing nodes in a code workbook.
Example: Implement the computation of area under precision recall curve (AUPRC) for the predictions of Logistic Regression models.# AUPRC Computation def logistic_regression_allpatients_auprc("REFERENCE TO THE LOGISTIC REGRESSION OUTPUT DATASET (e.g. aff_allpatients_lr_output)"): from sklearn.metrics import precision_recall_curve, auc import pandas as pd df = aff_allpatients_lr_output iterations = df.run.unique() model_name = "Logistic Regression" cohort_name = "All Patients" auprc_list = [] for itr in iterations: df_itr = df[df["run"] == itr] y_test = df_itr.loc[:,"test_label"].values y_pred = df_itr.loc[:,"test_prediction"].values precision, recall, thresholds = precision_recall_curve(y_test, y_pred) auprc = auc(recall, precision) auprc_list.append({"auprc": auprc, "run": itr, "model": model_name, "cohort": cohort_name}) return pd.DataFrame(auprc_list)Similarly, create multiple copies of this node with the same code but different inputs and outputs to generate AUPRC scores for Random Forest, SVM, and MLP models.
Templates
To overcome the cumbersome task of creating copies of the same piece of code in multiple nodes to perform the same function over different inputs (for example, computation of AUPRC scores for the outputs of different prediction models), we can create a reusable template which allows parameterization of the inputs for nodes.
More details and examples about creation and usage of templates is found in the N3C documentation . More information about Code Workbooks and Templates may be found in Section 8.3.2.
Create visualizations. Create another node in the workbook to draw Box plots of the AUPRC scores of the Logistic Regression, Random Forest, SVM, MLP models computed for ten iterations of the classification of cardiovascular sequelae. The inputs to this node will be the outputs generated from the nodes in the previous step that computed the AUPRC scores for each of the prediction methods.
# AUPRC Distribution Boxplot Visualization
from matplotlib import pyplot as plt
import seaborn as sns
import pandas as pd

def allpatients_auprc_boxplot(logistic_regression_allpatients_auprc,
                              svm_allpatients_auprc,
                              mlp_allpatients_auprc,
                              rf_allpatients_auprc):

    df = pd.concat([logistic_regression_allpatients_auprc,
                    svm_allpatients_auprc,
                    mlp_allpatients_auprc,
                    rf_allpatients_auprc])
    ax = sns.boxplot(x="model", y="auprc", data=df, notch=False)
    plt.title("Area under Precision-Recall Curve : All Patients")
    plt.show()
Select the ‘visualization’ tab at the bottom to view the output of this node.
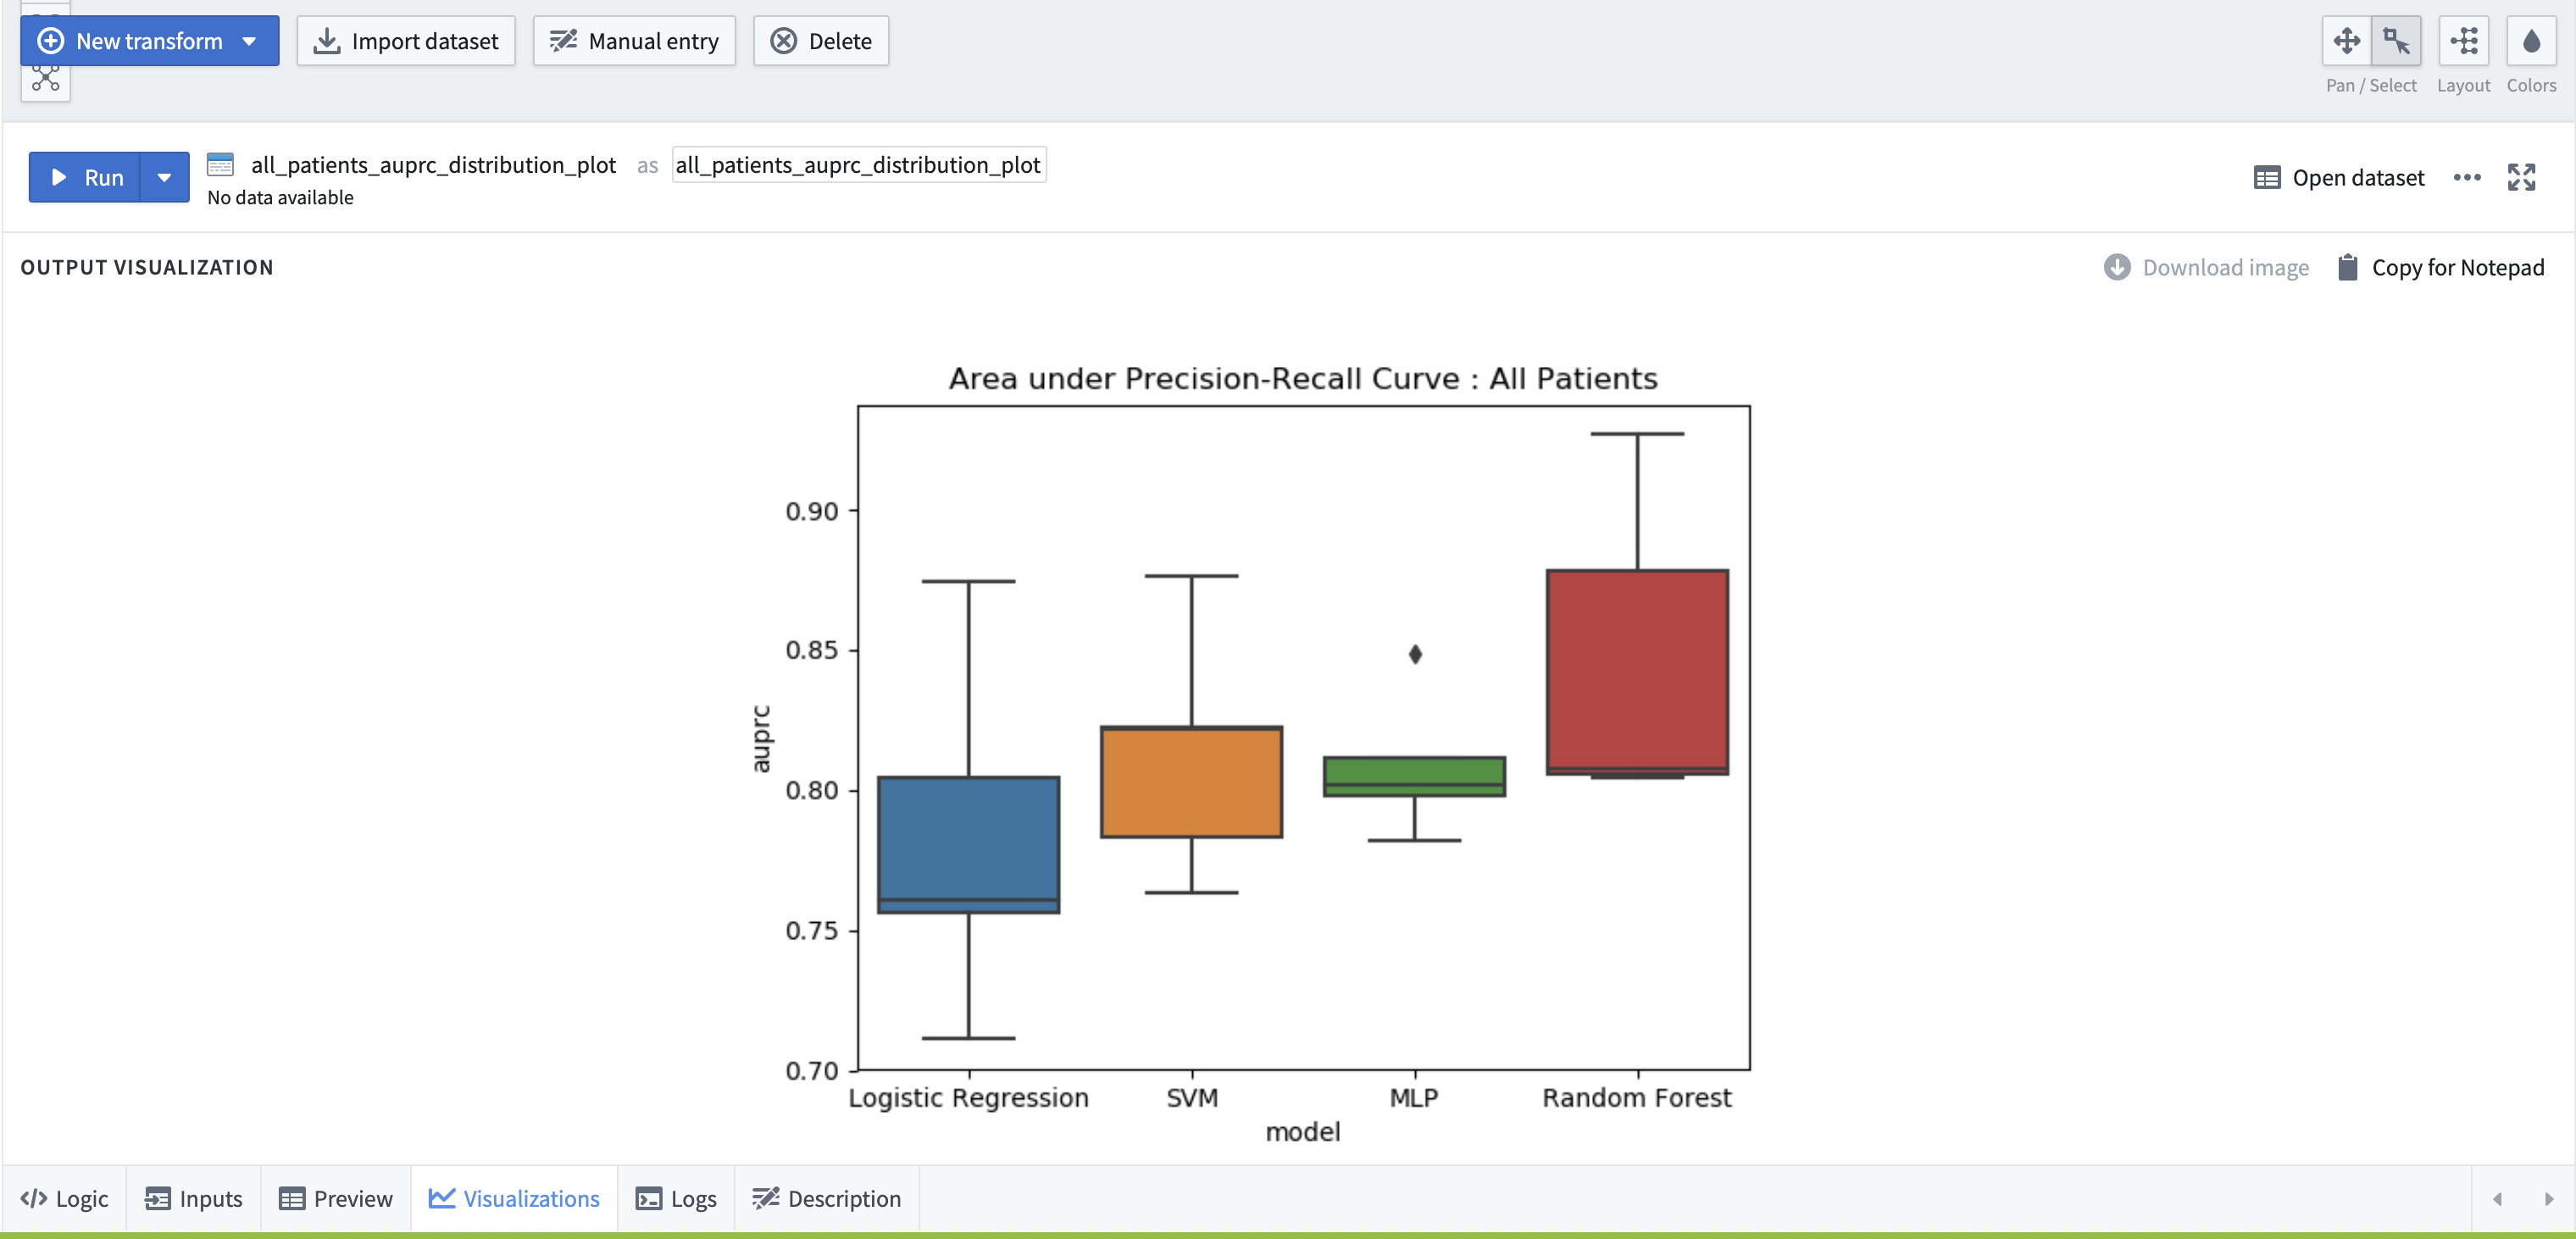
Figure 12.11: Viewing visualization outputs in Code Workbook.
12.4 Other topics
12.4.1 Deploying this ML code to your project/DUR
You can use the code above in your project by following these steps:
Open the code repository containing the code you would like to copy
Open the pulldown menu by the “Clone” button
Copy the git remote URL to your clipboard
On your local machine, open a command line and run this command:
git clone [paste the remote URL]In your DUR, create an empty code repository
In the empty code repository, open the pulldown menu by the “Clone” button and copy the git remote URL to your clipboard as above in steps (2) and (3)
In the cloned repository on your local machine, run these commands: See Pulling Changes, Pushing to GitHub, Branches and Code Repositories for details on how to do this.
git remote add mynewrepo [paste remote URL of new repository]
git push mynewrepo master
12.4.2 Using Spark ML pyspark.ml for time and compute intensive tasks
The examples above use standard Python to train and apply ML models. For ML tasks that are more compute intensive, consider using Apache Spark’s MLlib ML/pyspark.ml instead. A full discussion of Spark ML is beyond the scope of this chapter, but an implementation of a Spark ML model is provided in the same codebase as above, under the module named pysparkml. The official MLlib guide to SparkML is a good resource, and there are specific integrations with the Enclave documented here.
12.4.3 Using R in code workbooks
In the examples code reported above, we reported Python code, which works within Code Repositories (see Section 8.4.4). However, some ML algorithms make use of statistical inference/univariate statistics or multiple-imputation techniques, whose more reliable implementation (with underlying C/C++ engine) is available in R. If you prefer to use R, you can use code within Code Workbooks (see Section 8.4.3). Note also that the Enclave very recently enabled support for R Studio in the Enclave. Finally, a useful “Enclave ML Resources Overview” with links to various resources is available in the N3C Knowledge Store.