
Chapter Leads: Will Beasley, Jerrod Anzalone
Now that we have introduced N3C and described its motivation and importance, we’ll walk through the life cycle of an example project from onboarding to publishing. It isn’t easy to do yourself, but fortunately N3C has attracted a large and diverse set of researchers. Coupled with a large and diverse set of robust patient records, it is possible to complete an investigation within 6 to 12 months.
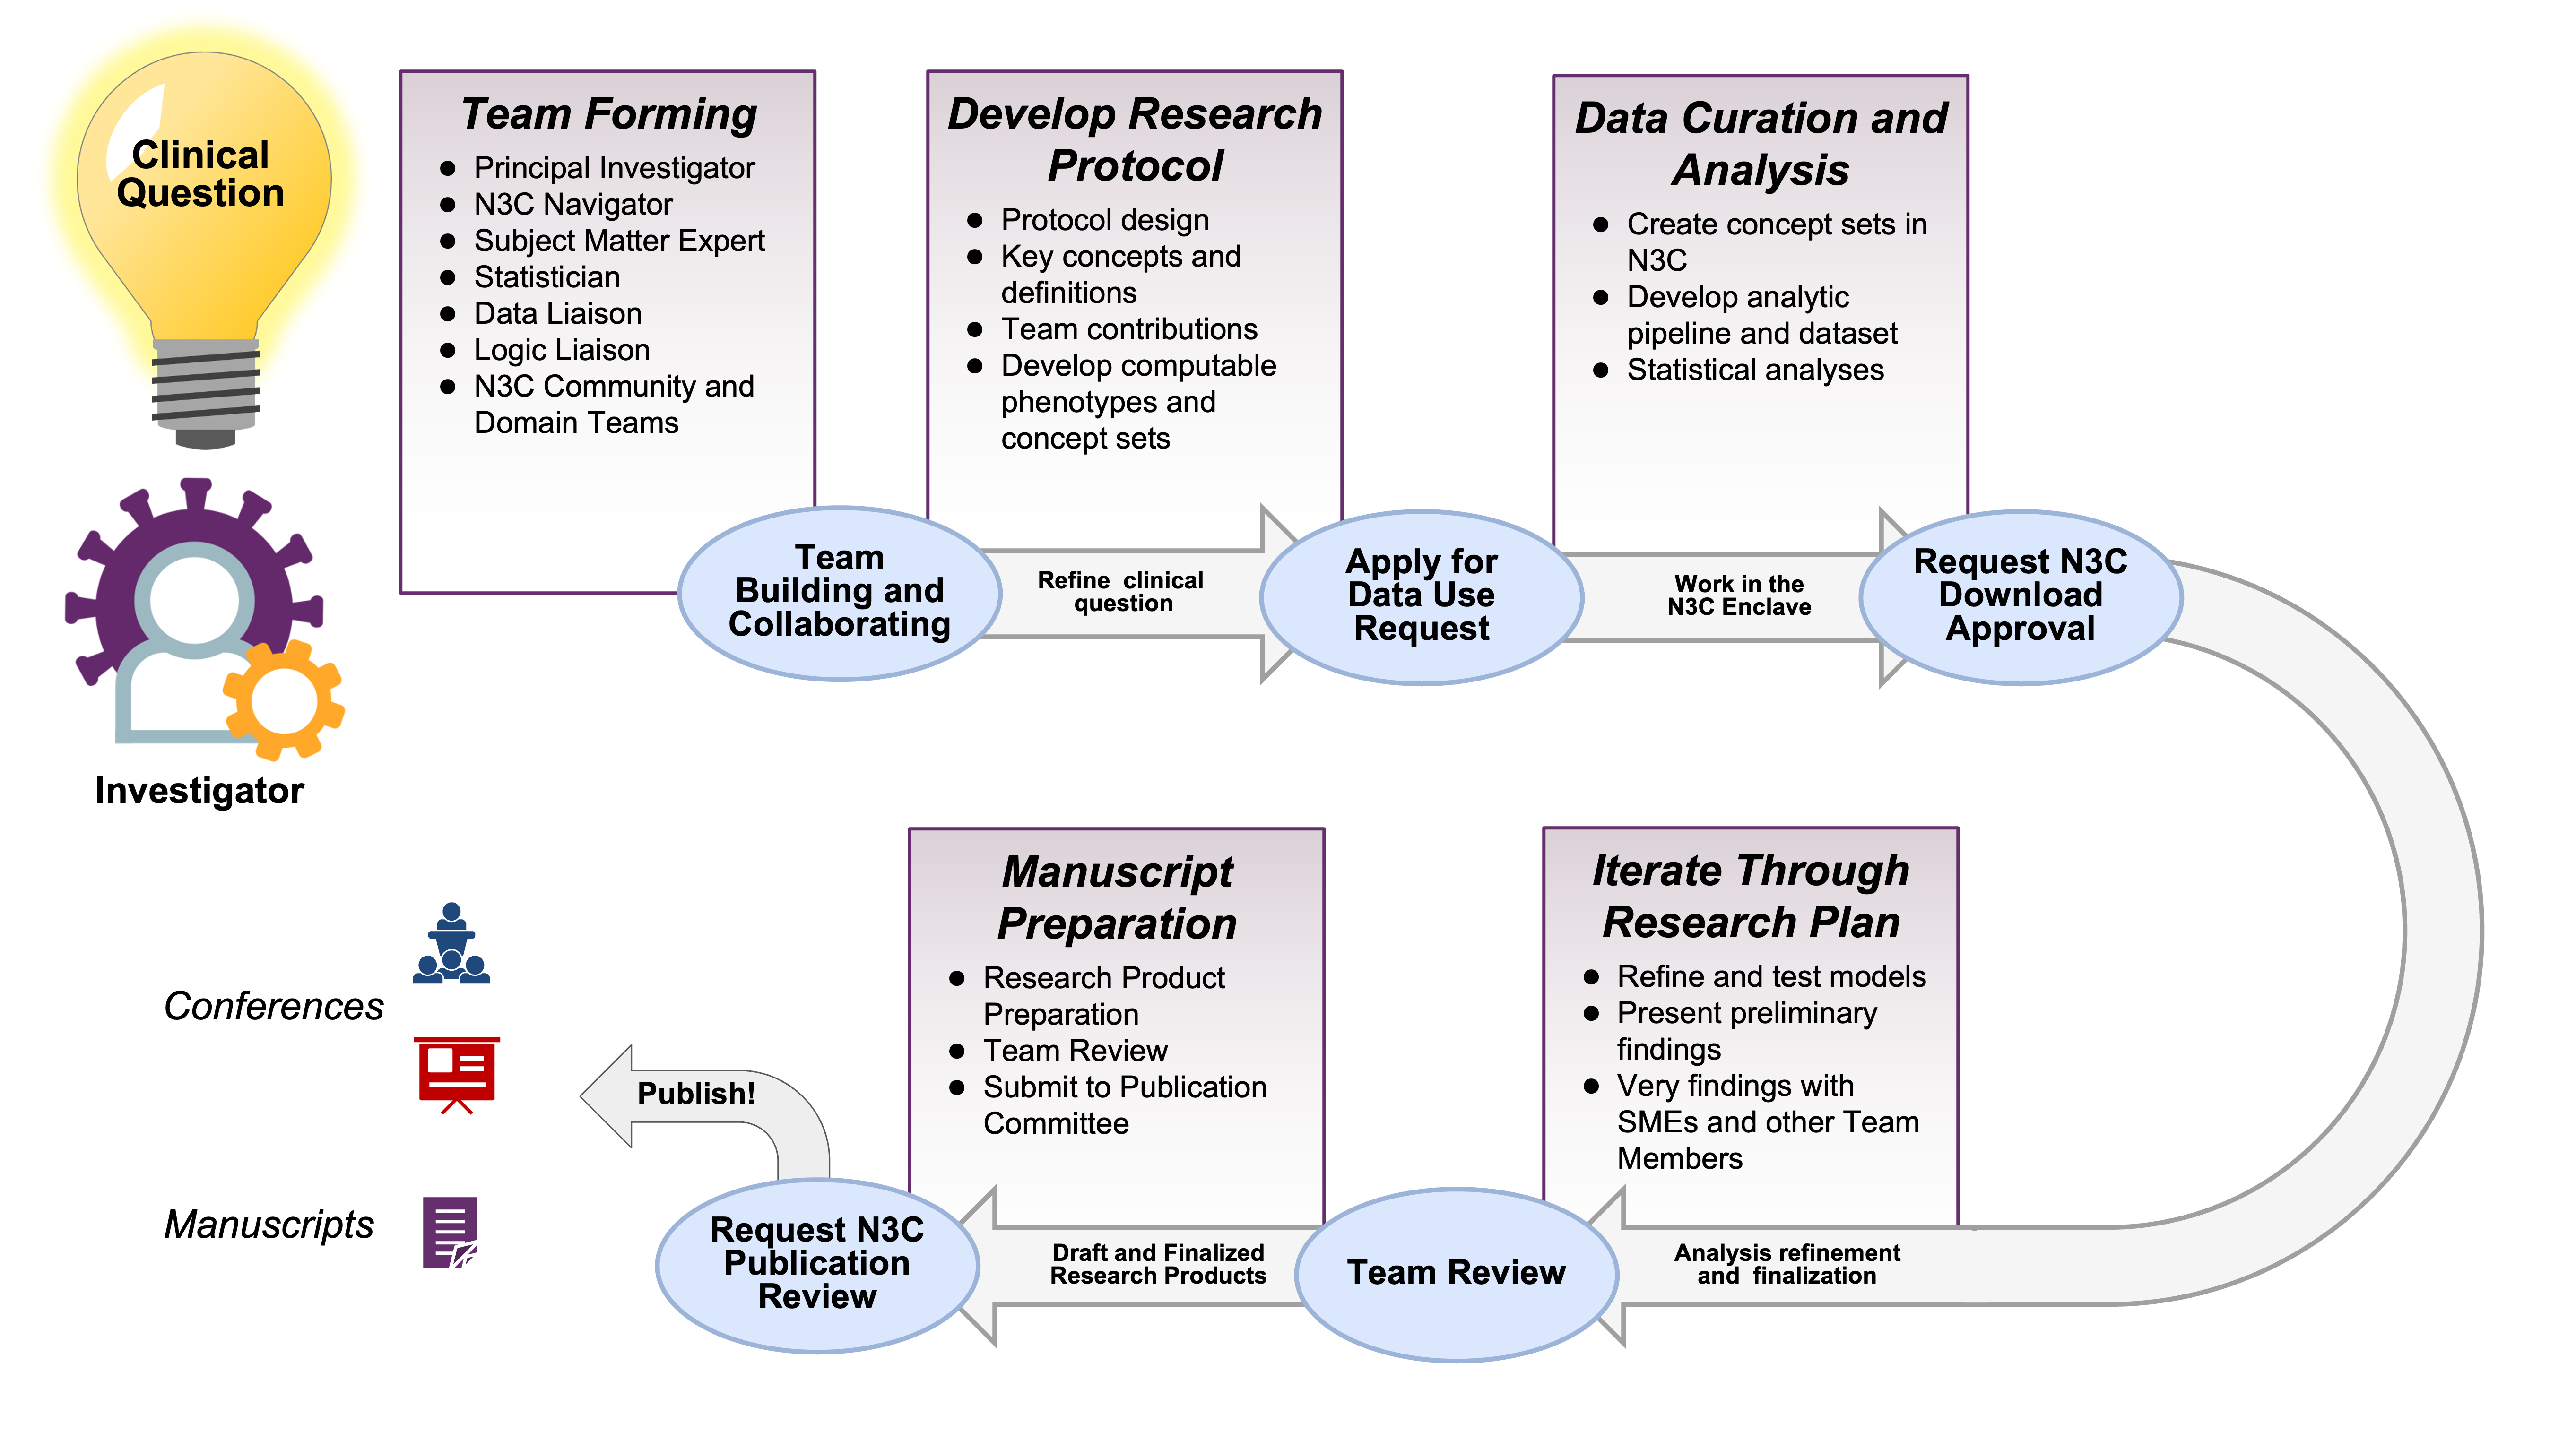
Suppose you are starting a project by yourself. The N3C ecosystem of researchers and resources is at your fingertips. You’ll likely be able to recruit collaborators with complementary skills (in addition to N3C-wide resources such as instructional material and office hours). If you would like to join an existing project, there are domain teams and ongoing projects that likely will fit your interests and benefit from your abilities. Figure 2.1 provides a high-level overview of the path of a typical N3C project from clinical question to research product.
Electronic Health Record (EHR) research has become an increasingly important tool to evaluate real-world evidence (RWE) to understand insights into treatment effectiveness, the impact of healthcare interventions, and our understanding of rare diseases. EHRs provide access to large, diverse patient populations and longitudinal data that allows observations of health changes over time or in cross-section. The strength of the EHR is that it reflects real-world care and is often a better representation of clinical care than the controlled settings of a traditional clinical trial. However, with this comes challenges of interpreting differences in care delivery, data standards, and merging expertise from clinical subject matter experts, clinical informaticists, biostatisticians and epidemiologists, medical terminologists, and other experts as healthcare data is linked with other health assets to move toward a more comprehensive representation of a patient’s lived experience relative their health outcomes.
2.1 Onboarding
As is typical for access to patient data outside your own institution, institutional participation in N3C requires legal agreements. The initial time investment is longer for an N3C investigation compared to most, but project-specific work tends to go faster. System access requires your institution to sign a Data Use Agreement (DUA) with N3C, and even with strong institutional support this can take several months in legal and administrative channels.1
Yet after clearing that first (tall) hurdle for your site, data access for each specific project takes only a week or two to be processed by the N3C Data Access Committee (DAC). That’s a remarkably short time considering the scale of available data. It’s likely quicker than initiating a project based on a single EHR from your site, and much quicker than accessing EHRs from 70+ sites individually.
Hover over a footnote to see the popup, without jumping to the bottom of the page.
Navigator: I’m glad you think the N3C might help your research. As I wrote in this morning’s email, the agreement between the university and the NIH was established last year, so don’t worry about that.3 There are two remaining steps. First, complete your personal paperwork.4 Second, submit a DUR tailored to your hypotheses.5
Investigator: Remind me. What is a DUR?
N: A Data Use Request describes your upcoming project. Once an NIH committee approves your proposal, your project’s code and data are protected in an associated workspace allotted on the NIH cloud.6 Everyone on your project shares this dedicated workspace. Your collaborators can request to join your workspace by signing a copy of your DUR in the Enclave as well.7
I: Umm, I think I got it.
N: It will make sense once you get it into it. Skim the example DUR proposals I’m sending now. Then start filling out this online form. Get as far as you can, and I’ll help with the rest. If there’s something I don’t know, I’ll ask a friend. The DUR application process will take about an hour. Then the proposal will likely be approved within a week or two. In the meantime, we can talk about potential collaborators.
I: Is there anything else I need to know?
N: The only other consideration at this point is whether you want your study to use Level 2 or Level 3 data. Level 2 data is fully de-identified, meaning all the dates are shifted within ±180 days. Also, all location identifiers are obfuscated to prevent reidentification, so you won’t have access to 5-digit ZIP Codes or other granular location measures. If you need either of those, you have to submit Level 3 data, which is a limited data set containing these data elements. Some institutions require an IRB protocol to submit a Level 3 DUR, so keep that in mind. Our institutional IRB has provided a letter covering most Level 3 DURs in N3C, so I’ll send that to you.
I: Ok, that’s very helpful. I may need real dates as I anticipate differences in treatment deliveries based on real-world availability. If I start with Level 2, am I stuck with Level 2?
N: No. If needed, you can request a workspace to be updated from Level 2 to Level 3 and receive IRB approval.
I: That’s great. I think we’ll start with Level 2. I’ll work on the research protocol now.
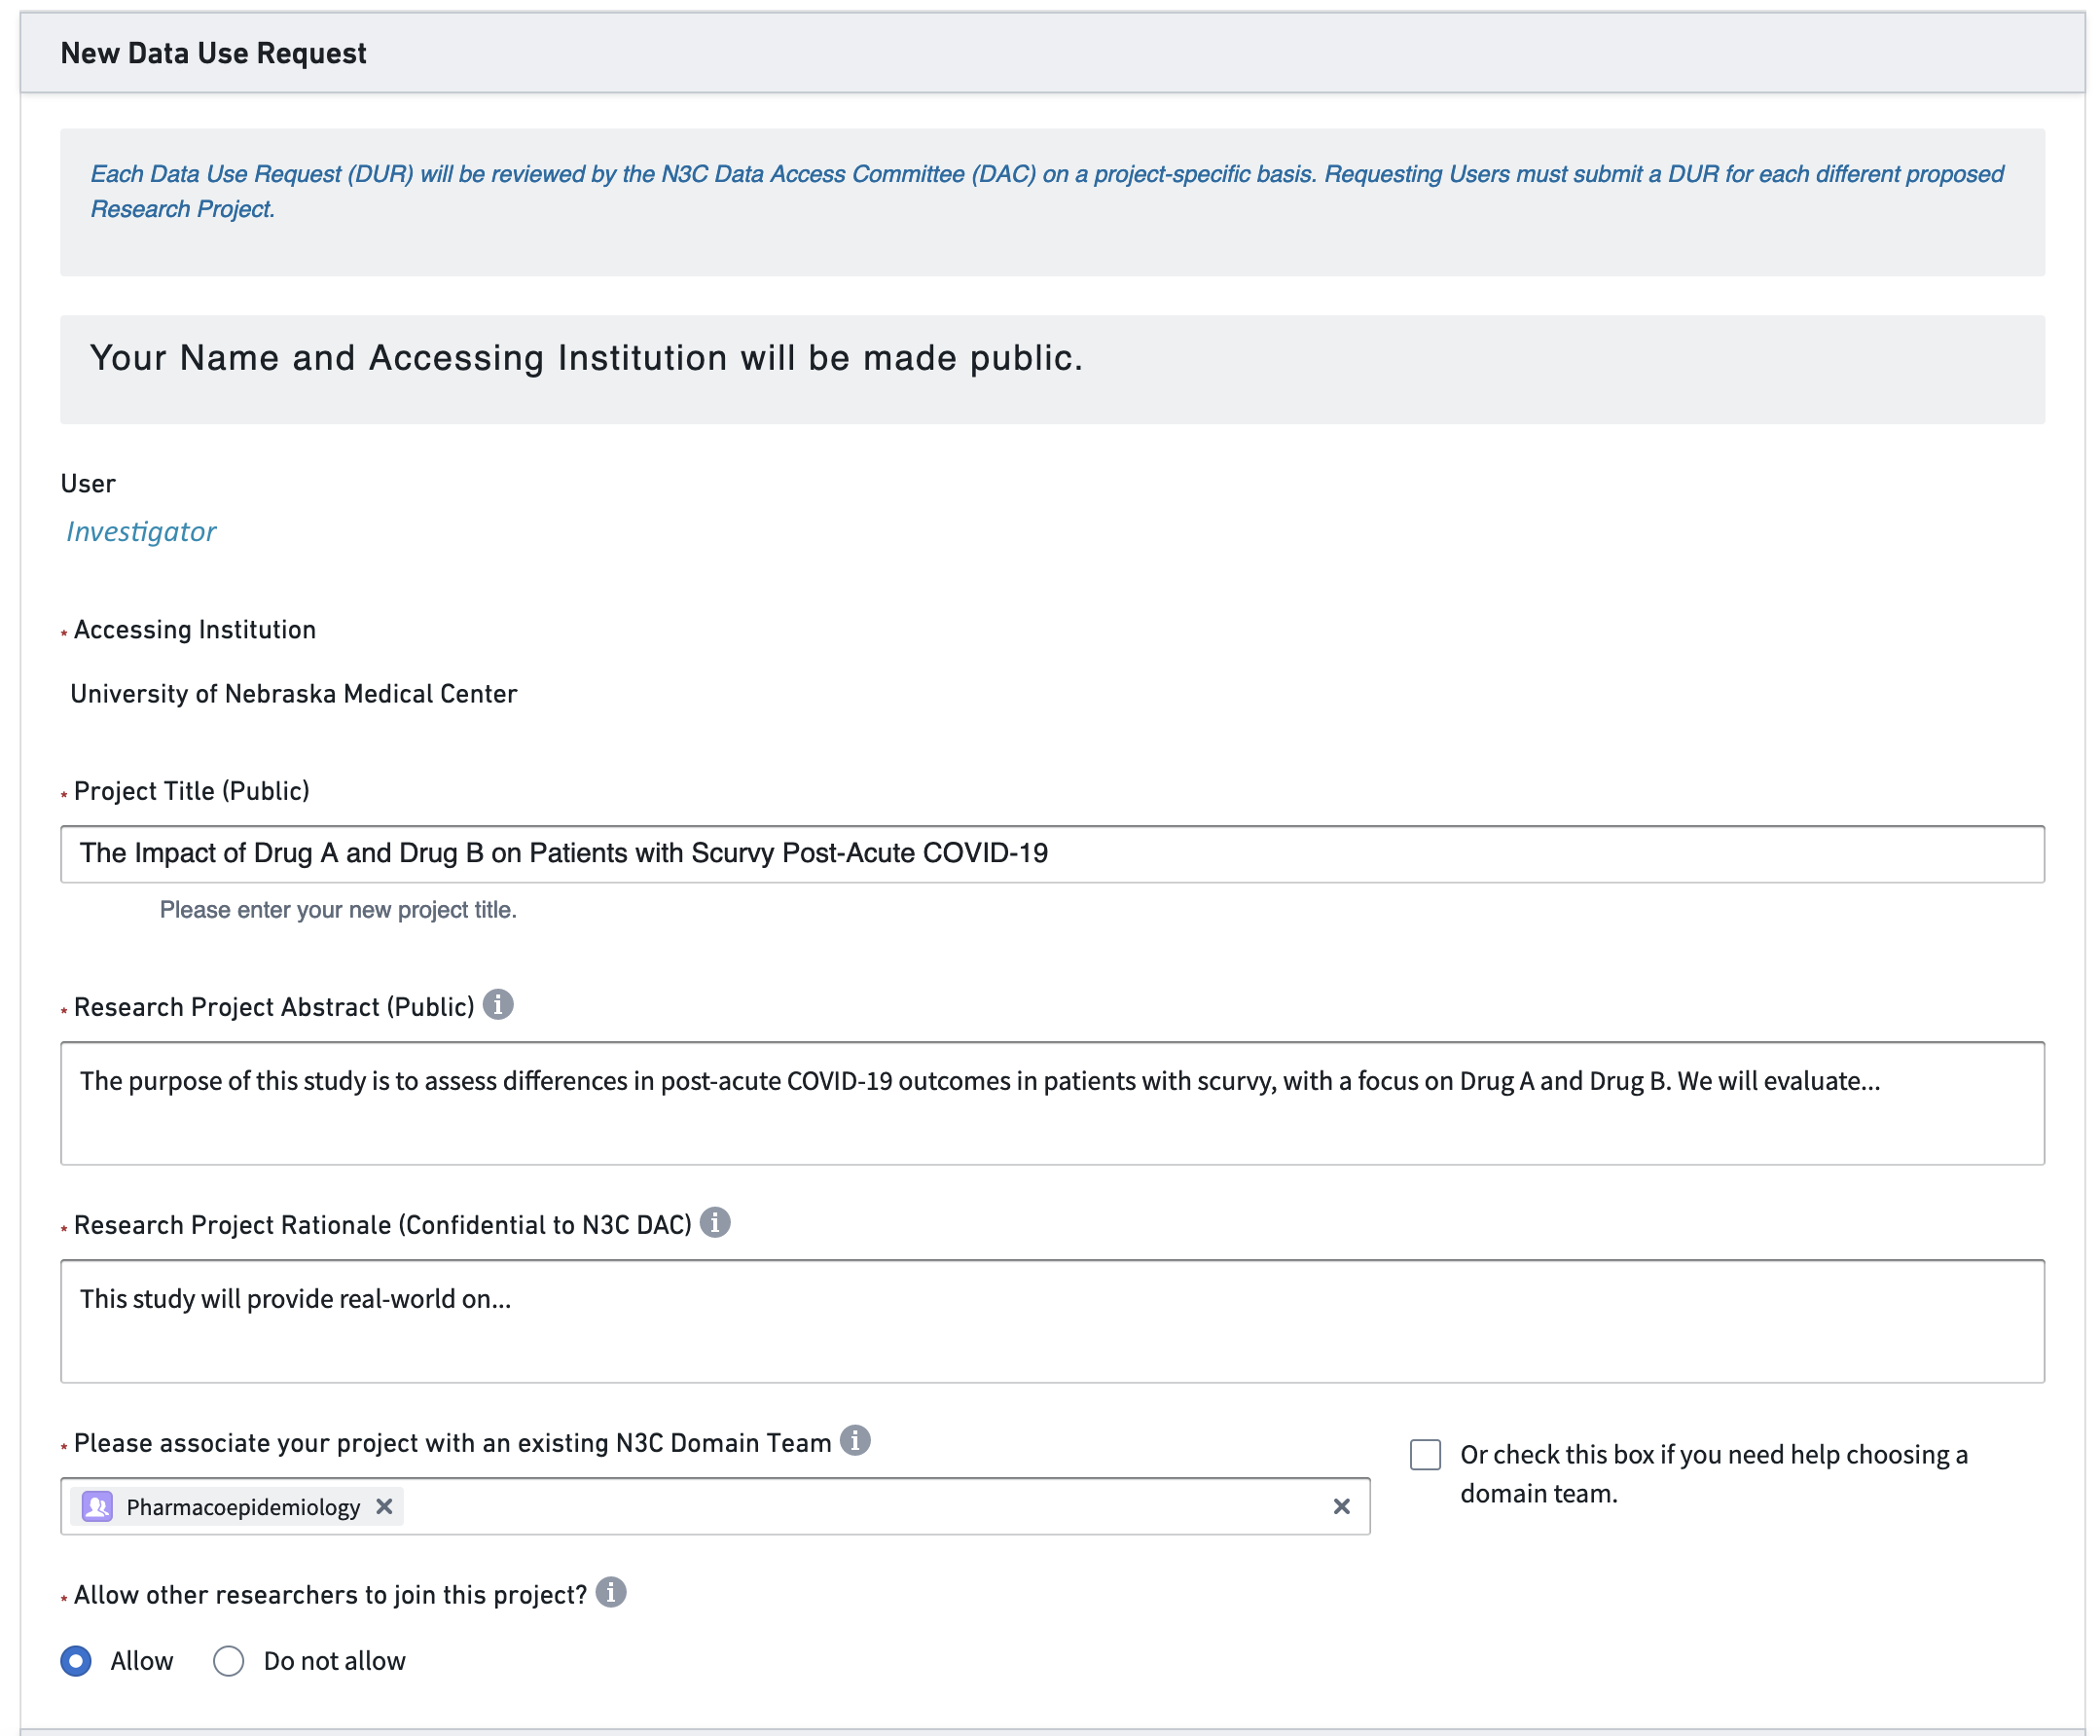
After some thought, the investigator develops a research protocol and submits the DUR in Figure 2.2.
2.2 Team Construction
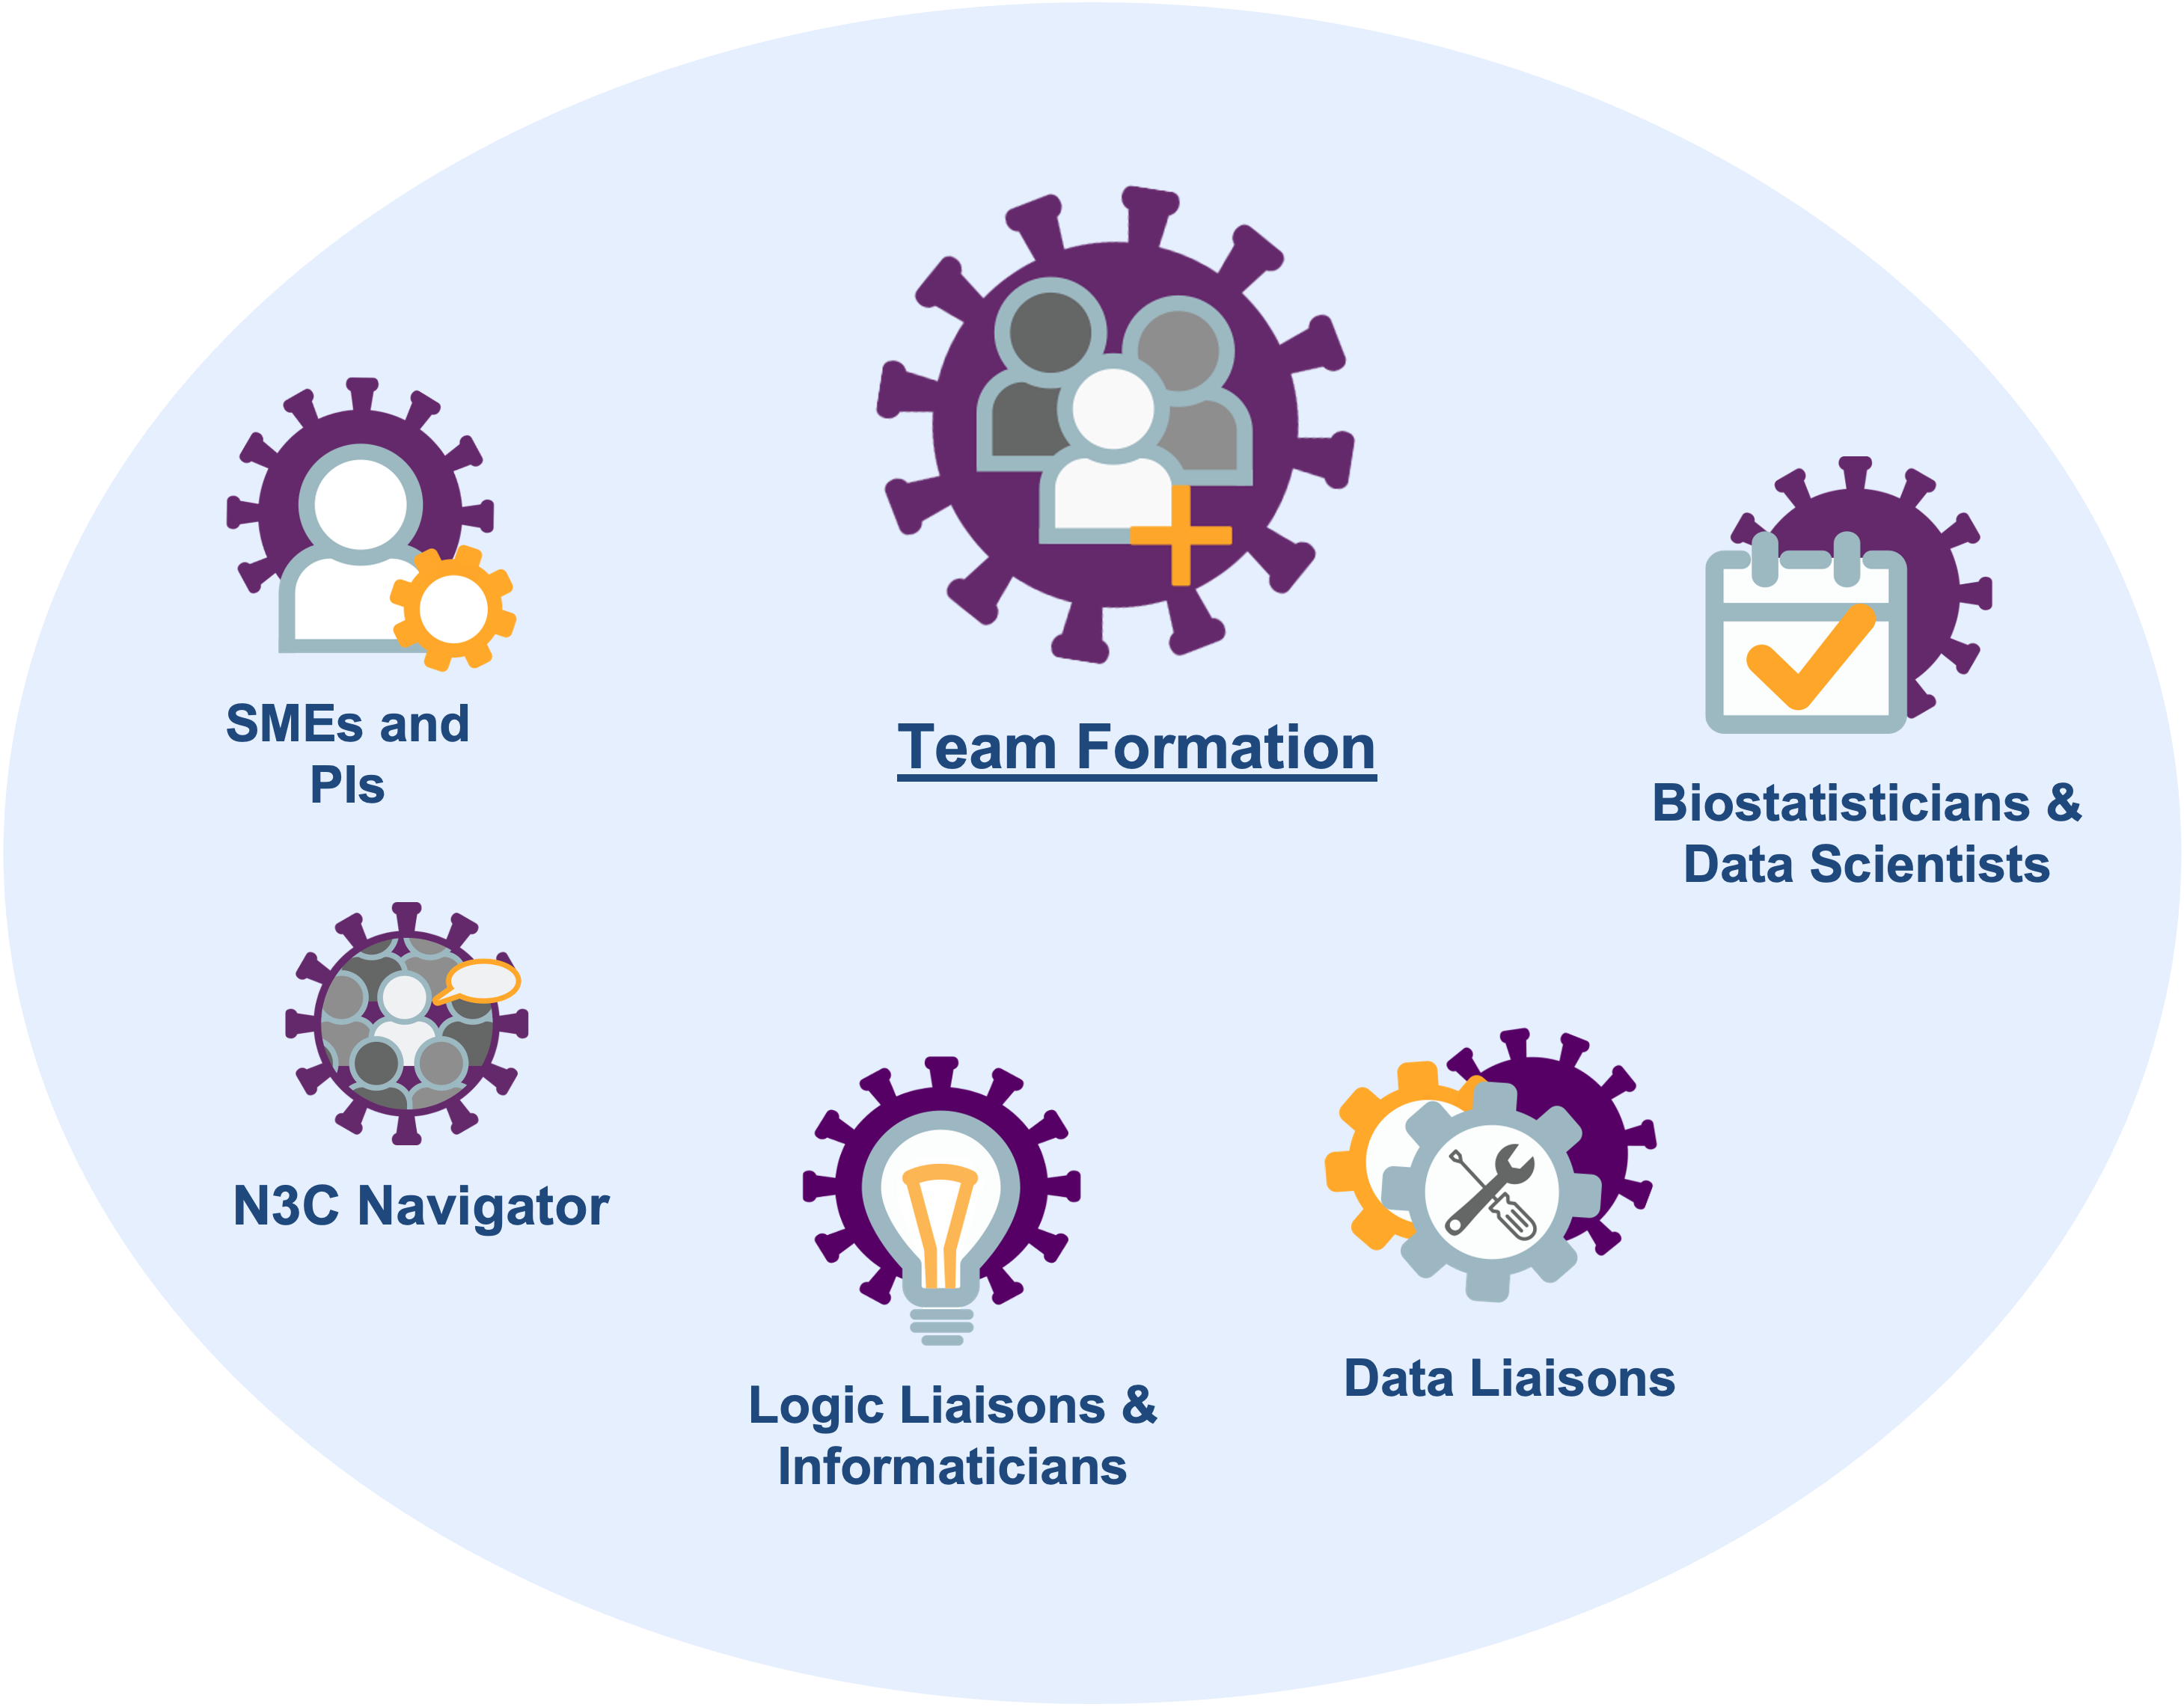
- a navigator who has learned the administrative and IRB requirements and can facilitate the investigation,
- a subject matter expert (SME) who has clinical experience with the disease of interest and can inform decisions with EHR variables,
- a statistician or data scientist who understands the limitations of observational collection and can model retrospective data,
- a logic liaison or informaticist who understands the challenges of EHRs and can extract and transform information (also known as a data engineer),
- a data liaison who has expertise in medical terminology to help develop concept sets or identify previously validated concept sets, and
- a principal investigator who knows the literature and can propose testable hypotheses and write the manuscript.
Figure 2.3 depicts these roles. Depending on the investigation and the personnel, sometimes one person can serve multiple roles.
N3C teams have some differences from conventional research teams at single sites. Some trends we have noticed are:
Most N3C teams have researchers from multiple institutions. In the experience of the authors and editors, this encourages more diverse opinions and more willingness to express constructive criticism. Researchers from a single institution/lab are sometimes more reluctant to generate contrary views.
The role of the navigator is often the most important member of a successful team. Your local investigations are likely guided by someone with years of experience with institutional safeguards and the personnel who can help when something stalls. N3C is bigger and younger than your site’s EHR research team, so an N3C project will benefit when guided by a bright, patient, and persistent navigator.
If your team needs someone, consider asking a relevant domain team for help identifying and approaching potential collaborators. Note that community-wide data and logic liaisons are available for consultation during regular office hours.8
2.3 Initial Meeting
- Investigator: Welcome everyone. We’d like to know if Drug A or Drug B is associated with better outcomes.
- Statistician: No problem. I can longitudinally model the type and amount of each medication received by each patient, relative to their intake date.
- Logic Liaison: Hmmm. I’m happy to produce a dataset with the
doseandfrequencycolumns, but you may not find it useful.9 Those two columns are sparsely populated and they look inconsistent across sites.10 - I: Bummer. Then what’s realistic or feasible?
- Subject Matter Expert: Maybe this simplifies the picture… In my clinical experience, a patient rarely switches between Drugs A & B. Based on the initial presentation, their provider will pick A or B, and complete the regimen unless there’s an adverse event.
- St: In that case, should my initial model have three levels for treatment: A, B, and A+B?
- I: Probably. In the N3C database, can someone tell me how many patients get both during the same visit?
- LL: I’m already logged into the Enclave11. Give me 2 minutes to add this drug to our templated fact tables12 which show same-day events and also summarize events at the patient level.13
- I: Oh my goodness, is that your cat? What a cutie!14
- LL after a few minutes: Ok, I got it. Unmutes himself. Ok, I got it. 40% of patients are Drug A only, 52% are Drug B only, while 8% have at least one administration of both Drug A & B in the same visit.
- SME: Weird. 8% is a lot more than I expected. I was thinking around 1%.
- LL: Hmm, let me check. Give me another minute.15
- LL after a few minutes: I see what you mean. It looks like the bulk of the combo patients were admitted in the spring of 2020. After Jan 2021, only 3% of patients have both Drug A & B.
- St: I was planning to model the phase of the pandemic (by including the diagnosis date as a covariate). I’ll test if there’s a significant interaction between time and treatment.
- I: I like that as a starting point. Regarding the question about dose and frequency… For now let’s assume the providers were following the current dosing guidelines. Therefore the
doseandfrequencyvariables can be dropped from the analyses. - St: Phew. I didn’t want to admit this. But I skimmed the dosing guidelines you emailed yesterday. It looked complicated. I wasn’t sure if I could appropriately incorporate those variables in the model.
- I: Well, that’s everything I wanted to cover today. See you in two weeks. Wait. I can’t believe I forgot. Sorry – our Navigator is sick this week and I’m almost worthless in her absence. Is everyone still on the call? For our secondary hypothesis, we want everything to connect to a patient’s diagnoses. …before, during, and after their covid hospitalization.
- LL: Bad news. This is kinda like the
doseandfrequencysituation a few minutes ago. The structure of the OMOP diagnosis table theoretically can connect a patient’s diagnoses across different locations. But the quality of the historical records depends on the site. Some places like Rhode Island leverage their state’s HIE16 to populate their N3C dataset. However other places are not as well connected. If a patient doesn’t have diagnosis records, it’s tough to determine if they are healthy, or if their primary care provider uses a siloed EHR.17 - I: Ugh. Good point.
- LL: But I’ve got good news. All the N3C contributors comprehensively capture all conditions diagnosed during the visit. Furthermore the diagnosis codes are standardized well across sites. That’s because most providers enter ICD codes into the EHR, which eventually can be cleanly mapped to OMOP’s standard concepts.18
- I: Well, that’s fine for this paper. Maybe our next manuscript will follow up with N3C’s death records.19
- SME: Sorry everybody, I have clinic this week, and they’re calling me. I need to drop.20
- St: Can I go back and ask a question about medications? I see that Drug A has 15 different brand names. I don’t recognize half of them. How should I classify them?
- LL: It’s actually worse than that. Sorry I’m a downer today. Can you see my screen? Drug A has 15 brand names and 200 different…21 So long story short, you’ll probably want to transform the two counts into two booleans.
- St: Ok. Thanks for simplifying the dataset for me.
2.4 Protocol, variables, & definitions
Realistically an investigation can use only a fraction of the terabytes of information in an EHR. The research team must identify the relevant variables among the qualifying patients to produce a coherent dataset tailored to their hypotheses.
While there are different approaches to developing a Research Protocol, the general steps involved include:
Define the research question: The first step is to clearly define the research question and the patient population of interest. This will guide the selection of relevant clinical concepts and data sources.
Determine the study design: The research team should choose an appropriate study design, such as a cohort study or case-control study, and determine the inclusion and exclusion criteria for the patient population.
Develop the analytic plan: The research team should prospectively specify the statistical methods to be used to analyze the data, including any adjustments for confounding variables and any sensitivity analyses.
Document the study protocol: The research team should document a detailed study protocol that includes all of the above information, as well as any other relevant information, such as ethical and regulatory considerations, data privacy and security measures, and data sharing agreements.
The N3C Data Enclave’s Protocol Pad supports the development and documentation of detailed study protocols.22
2.5 OMOP Tools
The Observational Health Data Sciences and Informatics (OHDSI) program maintains the Observational Medical Outcomes Partnership (OMOP) common data model (CDM). OMOP was funded by the US Food and Drug Administration in 2008, primarily for adverse drug events surveillance, but it has expanded to become the de-facto global research CDM. Detecting a small signal requires a large dataset – larger than any single healthcare database (OHDSI, 2019, Chapter 1). Given its ubiquity and active research community, OMOP is well-suited for N3C. OMOP has extensive tooling to support researchers, including two tools that directly support the curation of concept sets from the OHDSI program and one tool that is specific to N3C:
Atlas provides a user-friendly interface for querying and analyzing data in the OMOP CDM. In the context of N3C, it supports browsing medical terminology and supports the development of concept sets.
Athena is a centralized repository of standardized clinical vocabularies.
The N3C Concept Set Browser is an N3C-specific tool that allows you to explore and modify existing concept sets as well as create new concept sets to fit your exact study needs.
Concept sets, described in detail in Chapter 7 and Chapter 8, are the basic building blocks of an analytic dataset. They contain lists of medical codes, usually restricted to a very specific definition or computable phenotype. In N3C, they are used to identify cohorts or exposures to answer a research question. They point to standardized vocabularies and clinically organized domains in the OMOP CDM (e.g., drug, condition, measurement).
In general, the overall process involved in developing concepts is as follows:
- Define the research question: The first step is for the research team to clearly define the research question and population of interest, which will guide the selection of relevant clinical concepts.
- Explore the data: Using Atlas or the N3C Concept Set Browser, the team member filling as the data liaison will explore the data available or existing concept sets to identify relevant clinical concepts.
- Refine the concept set: The data liaison works with the SME to refine the concept set, which is usually an iterative process, to include clinically relevant and exclude clinically irrelevant concepts.
- Validate the concept set: Once the concept set has been defined, the SME and logic liaison validate the concept set and publish it in the N3C Concept Set Browser, which allows for reuse across the N3C community.
- Data Liaison: Good morning! I’ve started browsing existing concept sets for anemia and found one potential option.
- Subject Matter Expert: That’s great. Let’s take a look.
- DL pulls up a concept set for anemia: This is one that’s out there. It uses the parent SNOMED CT Code 271737000.
- SME: Hmm…this isn’t quite right. We need anemia caused by blood loss. A lot of these are unrelated.
- DL: Gotcha. Let’s take a look at the hierarchy and see if we can refine it. We can look at the descendants and go from there.
Three hours elapse. - DL: Ok, great. I think we have a working example. I’m going to extract all of these into a spreadsheet. Please go through this one more time and then I’ll share it with the group to review.
2.6 Data Preparation
After clarifying all the data elements and study protocol, the next step is to curate an analytic dataset. Depending on the study design, this can be organized in multiple ways. In general, an analytic dataset is organized at either the person or encounter level. This means that you’ll have a single analytic dataset per patient or one row per encounter. This topic is covered in greater detail in the Tools and Best Practices chapters.
Using the previously defined protocol, the informaticist will use the concept set browser to identify or create relevant concept sets and prepare the analytic dataset in a code workbook or code repository in the N3C Data Enclave. This time-intensive process produces a dataset that the team’s statistician will analyze. N3C Logic Liaison fact tables and templates are available to help build these datasets more quickly using defined pipelines where the custom concept sets can quickly be added as inputs.
The N3C Logic Liaisons also provide tools that assess the quality of your derived dataset. These tools inform decisions such as dropping specific sites or variables from the analysis (for example, if a site appears to be systematically missing a variable that is important to your hypothesis).23
| Age | Sex | Race Ethnicity | Quarter of COVID dx | Smoking Status | Scurvy pre-COVID | Med A | Med B | Diabetes pre-COVID | COPD pre-COVID | Liver Disease pre-COVID | Cancer pre-COVID | Renal Disease pre-COVID | COVID Hospitalization | ECMO IMV | Time to ECMO IMV | Death | Time to Death |
|---|---|---|---|---|---|---|---|---|---|---|---|---|---|---|---|---|---|
| 27 | M | Non-Hispanic White | 2022 Q2 |
Current or Former Smoker | 0 | 0 | 0 | 0 | 1 | 0 | 0 | 0 | 1 | 0 | 28 | 0 | 28 |
| 75 | F | Hispanic or Latinx | 2021 Q1 |
No Documented History of Smoking | 0 | 0 | 0 | 0 | 0 | 0 | 1 | 0 | 0 | 0 | 28 | 0 | 28 |
| 54 | M | Non-Hispanic Black or African American | 2020 Q4 |
No Documented History of Smoking | 1 | 1 | 0 | 1 | 0 | 0 | 1 | 0 | 1 | 0 | 1 | 1 | 1 |
| 34 | F | Non-Hispanic White | 2023 Q1 |
Current or Former Smoker | 1 | 0 | 1 | 1 | 0 | 1 | 0 | 0 | 1 | 1 | 3 | 1 | 5 |
| … | … | … | … | … | … | … | … | … | … | … | … | … | … | … | … | … | … |
2.7 Analyses
- Navigator: Welcome everyone. Today we’ll review the initial analytic dataset and the next steps in the analysis.
- Informaticist: Yep. I’ve made a new code workbook in your folder in the project workspace. Can you pull it up and we can take a look?
- Statistician: Sure. Did you send me the dataset? I don’t remember seeing an email.
- N: Remember, everything has to be done within the secure N3C platform. So you won’t be doing anything on your local machine. It all has to be done within the platform. Do you know how to get to the project workspace?
- S: …remind me, please?
- A few minutes later after a refresher.
- S: Ok, great. I think I get it. So it’s not too different from using R in RStudio as long as I follow the documentation you sent me. I think I can figure that out. What happens when I want to share results with the rest of the team? Can I email everyone the initial results?
- N: Ehh, there’s a better way to securely share intermediate results. First, create a blank report and add stuff like tables, graphs, summary results, and model output to a report. Next, share the report (within the N3C Data Enclave) with those who have access to our project workspace. Then when it’s time to share results outside the platform, we’ll submit a download review request (DRR) to ensure compliance with the N3C privacy and security expectations. Once N3C leadership approves the DRR, the report can be extracted from the Enclave.
- S: Gotcha. I’ll reach out if I have any questions once I get to that point. Thanks!
descriptive_statistics <- function(analytic_dataset) {
  requireNamespace("gtsummary")

   analytic_dataset |>
    dplyr::select(
      scurvy_indicator_before_covid,
      gender,
      medication_a,
      medication_b,
    ) |>
    gtsummary::tbl_summary(
      by = scurvy_indicator_before_covid
    ) |>
    tibble::as_tibble(col_labels = FALSE)
}
Which produces the following Table 2.2.
| Characteristic | No History of Scurvy |
History of Scurvy |
|---|---|---|
| Patient Count | 19,871 | 2,199 |
| Age, Median (IQR) |
50 (25, 75) |
51 (27, 75) |
| Race/Ethnicity | NA | NA |
| Non-Hispanic White |
7,834 (39%) |
883 (40%) |
| Non-Hispanic Black or African American |
3,970 (20%) |
431 (20%) |
| Hispanic or Latinx | 3,986 (20%) |
430 (20%) |
| Missing/Other | 4,081 (21%) |
455 (21%) |
| Medication A | 3,017 (15%) |
318 (14%) |
| Medication B | 1,661 (8%) |
173 (8%) |
After repeating this for the remaining analyses for the project, the statistician creates a report and requests it be reviewed by the N3C Download Review Committee.
- Statistician: Good afternoon! I just received notification from N3C that my download review request was approved. What happens now?
- Navigator: That’s great! Now that it’s been approved, you can go into the Download Review Dashboard and there’s an area where you can safely download the results. The review comes with a DRR ID, which is required to download the associated results.
- S: Ok. And then I can send it out to the rest of the team?
- N: Yep! Once it’s been reviewed, you can share it with the rest of the team outside of the Enclave.
- S: Great. Thank you! I’ll set up a time to review the results with the team next week.
2.8 Manuscript Preparation
- Investigator: Thanks everyone for making this meeting. I hope you’ve had a chance to review the results that were circulated last week.
- Subject Matter Expert: They looked great. Very unexpected, but intriguing results. I was surprised that outcomes were so much better in those exposed to Medication B than to Medication A.
- Team reviews the results in detail. Manuscript write-up divided amongst the study team.
- I: Ok, so we should all know what the next steps are for preparing the manuscript. Are there any other requirements from N3C before we can submit the paper to our target journal?
- Navigator: Good question. The manuscript draft has to be reviewed by the N3C Publication Committee. They meet weekly and will review the draft to make sure it’s compliant with N3C policies and adheres to the original research question proposed by us.
- I: Ok, that makes sense. How long does it usually take?
- N: In my experience, it’s a pretty quick turnaround. Usually 1-2 weeks unless there are serious issues with the draft. They are primarily concerned about compliance with N3C policies, such as not having small cell counts and having gone through the download review process. Since we were following these guidelines, it should be a quick review.
- I: Awesome. I hope you’ll still be available to help when we get to the step. Thank you!
- N: Of course. Let’s plan on meeting after the draft is closer to being finished.
- I: Sounds great. See you all in two weeks!
This chapter was first published May 2023. If you have suggested modifications or additions, please see How to Contribute on the book’s initial page.
On the other hand, hundreds of institutions have already done so; check the list at https://covid.cd2h.org/duas. This process is described in the Enclave Registration section of Chapter 5.↩︎
This “navigator” role may be called something differently at your institution; the roles are defined below in Section 2.2. If your institution doesn’t support this position, we suggest starting with the N3C Office Hours or other avenues of support.↩︎
Read about the institutional-level DUA in Section 5.4.↩︎
See Section 5.3.↩︎
Project-level paperwork is discussed in Section 6.4.↩︎
See Section 11.9.↩︎
OMOP tables are designed to represent data from many sources but typically need to be transformed before analysis.↩︎
See Section 7.3.3.1 and Section 11.9.2↩︎
Read about SQL, Python, and R transforms in Code Workbooks in Chapter 8.↩︎
There is a brief discussion of SME’s cat.↩︎
There is a brief discussion of S’s daughter strutting in the background wearing a cowboy hat and waving a fairy wand.↩︎
The benefits and caveats of real-world data are a theme throughout the book, particularly in the best practices discussed in Chapter 9.↩︎
Authoring and using concept sets is described in Chapter 7. Mapping an ICD to SNOMED diagnosis code is an example of mapping a “non-standard” to a “standard” concept, discussed in Chapter 7.↩︎
Mortality records are discussed in Section 7.5.3.↩︎
Everyone says goodbye to the cat.↩︎
The conversation gets really technical. More technical than the editors want for this chapter.↩︎
Section 8.4.1 describes the tool and Chapter 9 describes the best practices.↩︎