
Chapter Leads: Ken Wilkins, Harold Lehmann
9.1 Overview
While analyses within N3C fall under the general category of “Real World Data Analysis” (RWD analysis), there is no single design or practice that applies to every study. All the same, important data considerations can guide one’s analytic plans and decisions, which effectively become the pivot points in any RWD investigation’s research lifecycle. In this chapter, we will provide suggestions and pointers to resources that we hope will help the analyst in the majority of studies, and guide the content of discussions with their domain expert collaborators. Recognizing that any analyst may come from one of a wide range of backgrounds, we have structured the chapter to be self-guiding. Data scientists with backgrounds in machine learning and computer science will benefit from studying principles entailed in RWD biomedical methods in and beyond the confines of N3C (and should look at the Machine Learning chapter). Researchers trained in traditional data analysis from schools of epidemiology, biostatistics, or econometrics will be reminded of concerns such as over-reliance on overly-simplified parametric models and pitfalls of overfitting. All schools of thought could benefit from more careful consideration of how their analytic decisions may impact the findings - and the limits in the scope of such findings’ generalizability - and just what best practices may help them to navigate potential pitfalls to reach more reliable conclusions.
The Collaborative Analytics workstream within N3C first recognized the need to form a group looking at data methods that were applicable to N3C data, and any standards that could be leveraged and refined to make optimal use of this unique resource - noting that the resource itself was being actively refined as more was learned from applying methods to its data. Early on, the resulting Applicable Data Methods and Standards (ADMS, sometimes written as ADM&S) group established a number of principles, that have since been refined by cross-collaboration with other groups.
9.1.1 Goals
Our goals were to:
9.1.1.1 Make it easy to do the best analysis
Analysts from a wide range of projects have created a number of tools and resources to work towards this goal.
This includes:
9.1.1.2 Encourage and disseminate best practices, but do not require specific approaches
“Best practice” refers to guidelines, such as those outlined by the FDA (2017; 2021) and methodologists (Franklin et al., 2021). While a number of groups are available for consulting (Logic Liaisons, ADMS, Machine Learning Domain Team), there is no policing of analyses. ADMS, in particular, is a cross-cutting Domain Team that provides a forum for discussing analytic issues that are important across N3C. Example issues include the difficulty of defining study-specific “control” cohorts when needed. The Good Algorithmic Practice (GAP) group is a forum that includes machine learning and other general discussions related to data and analysis quality.
9.1.2 Practices
Most components of high-quality research lie with the research teams themselves. Important practices contributing to reproducible, reliable work include:
9.1.2.1 Ensuring validated or mature code
We do recommend peer review of code, as is suggested, prior to posting code workbooks to the Knowledge Store.
9.1.2.2 Making methods and code findable and accessible (FA)
N3C’s key library of code is the Knowledge Store. Accessibility currently depends on perusing titles and on a short taxonomy of artifact types (“artifacts” meaning figures, tables, concept sets, variable definitions, analytic code). Community Notes support a folksonomy of tags of both domain and methodological bents.
9.1.2.3 Making clear both the intention of a method as well as how it works
Documentation of code is left to the analyst. Given the diversity of tools and methods available in N3C, there is no recommended standard for documentation. The Logic Liaison Templates, though, provide excellent models.
9.1.2.4 Ensuring reproducibility and reuse (IR)
ProtocolPad is an emerging tool to implement documentation in detail and, we hope, to encourage reuse beyond the Knowledge Store. We are developing Templates that are more general than Knowledge Store items and function more as a guide (analytic decision support) than as programming code that can be modified. Both Code Workbooks and Code Repositories can be exported as Git repositories for hosting on GitHub or similar.
9.1.2.5 Building on the experience across and within networks
Outside N3C, the experience of OHDSI, in particular, will be referenced below. Within N3C, discussions and work within Domain Teams are enriched by individuals’ experiences in a wide variety of studies and research configurations.
9.1.2.6 Anticipate analytic problems before they arise
We encourage discussion of issues in advance of the analysis. For hypothesis-driven studies, we recommend finalizing the analytic protocol before outcomes are assessed.
9.1.2.7 Ensure state-of-the-art analyses, appropriate to the real-world data of the Enclave
We encourage conformance to methodology checklists. Relevant ones are STROBE, RECORD, TRIPOD, CERBOT, and STaRT-RWE.
The high-level sequence of research below is based on experience in the Enclave and addresses some of the “what” needs to be accomplished in a research project in parallel to the “how” of previous chapters.
9.2 Protocols: A Framework for the Research Lifecycle
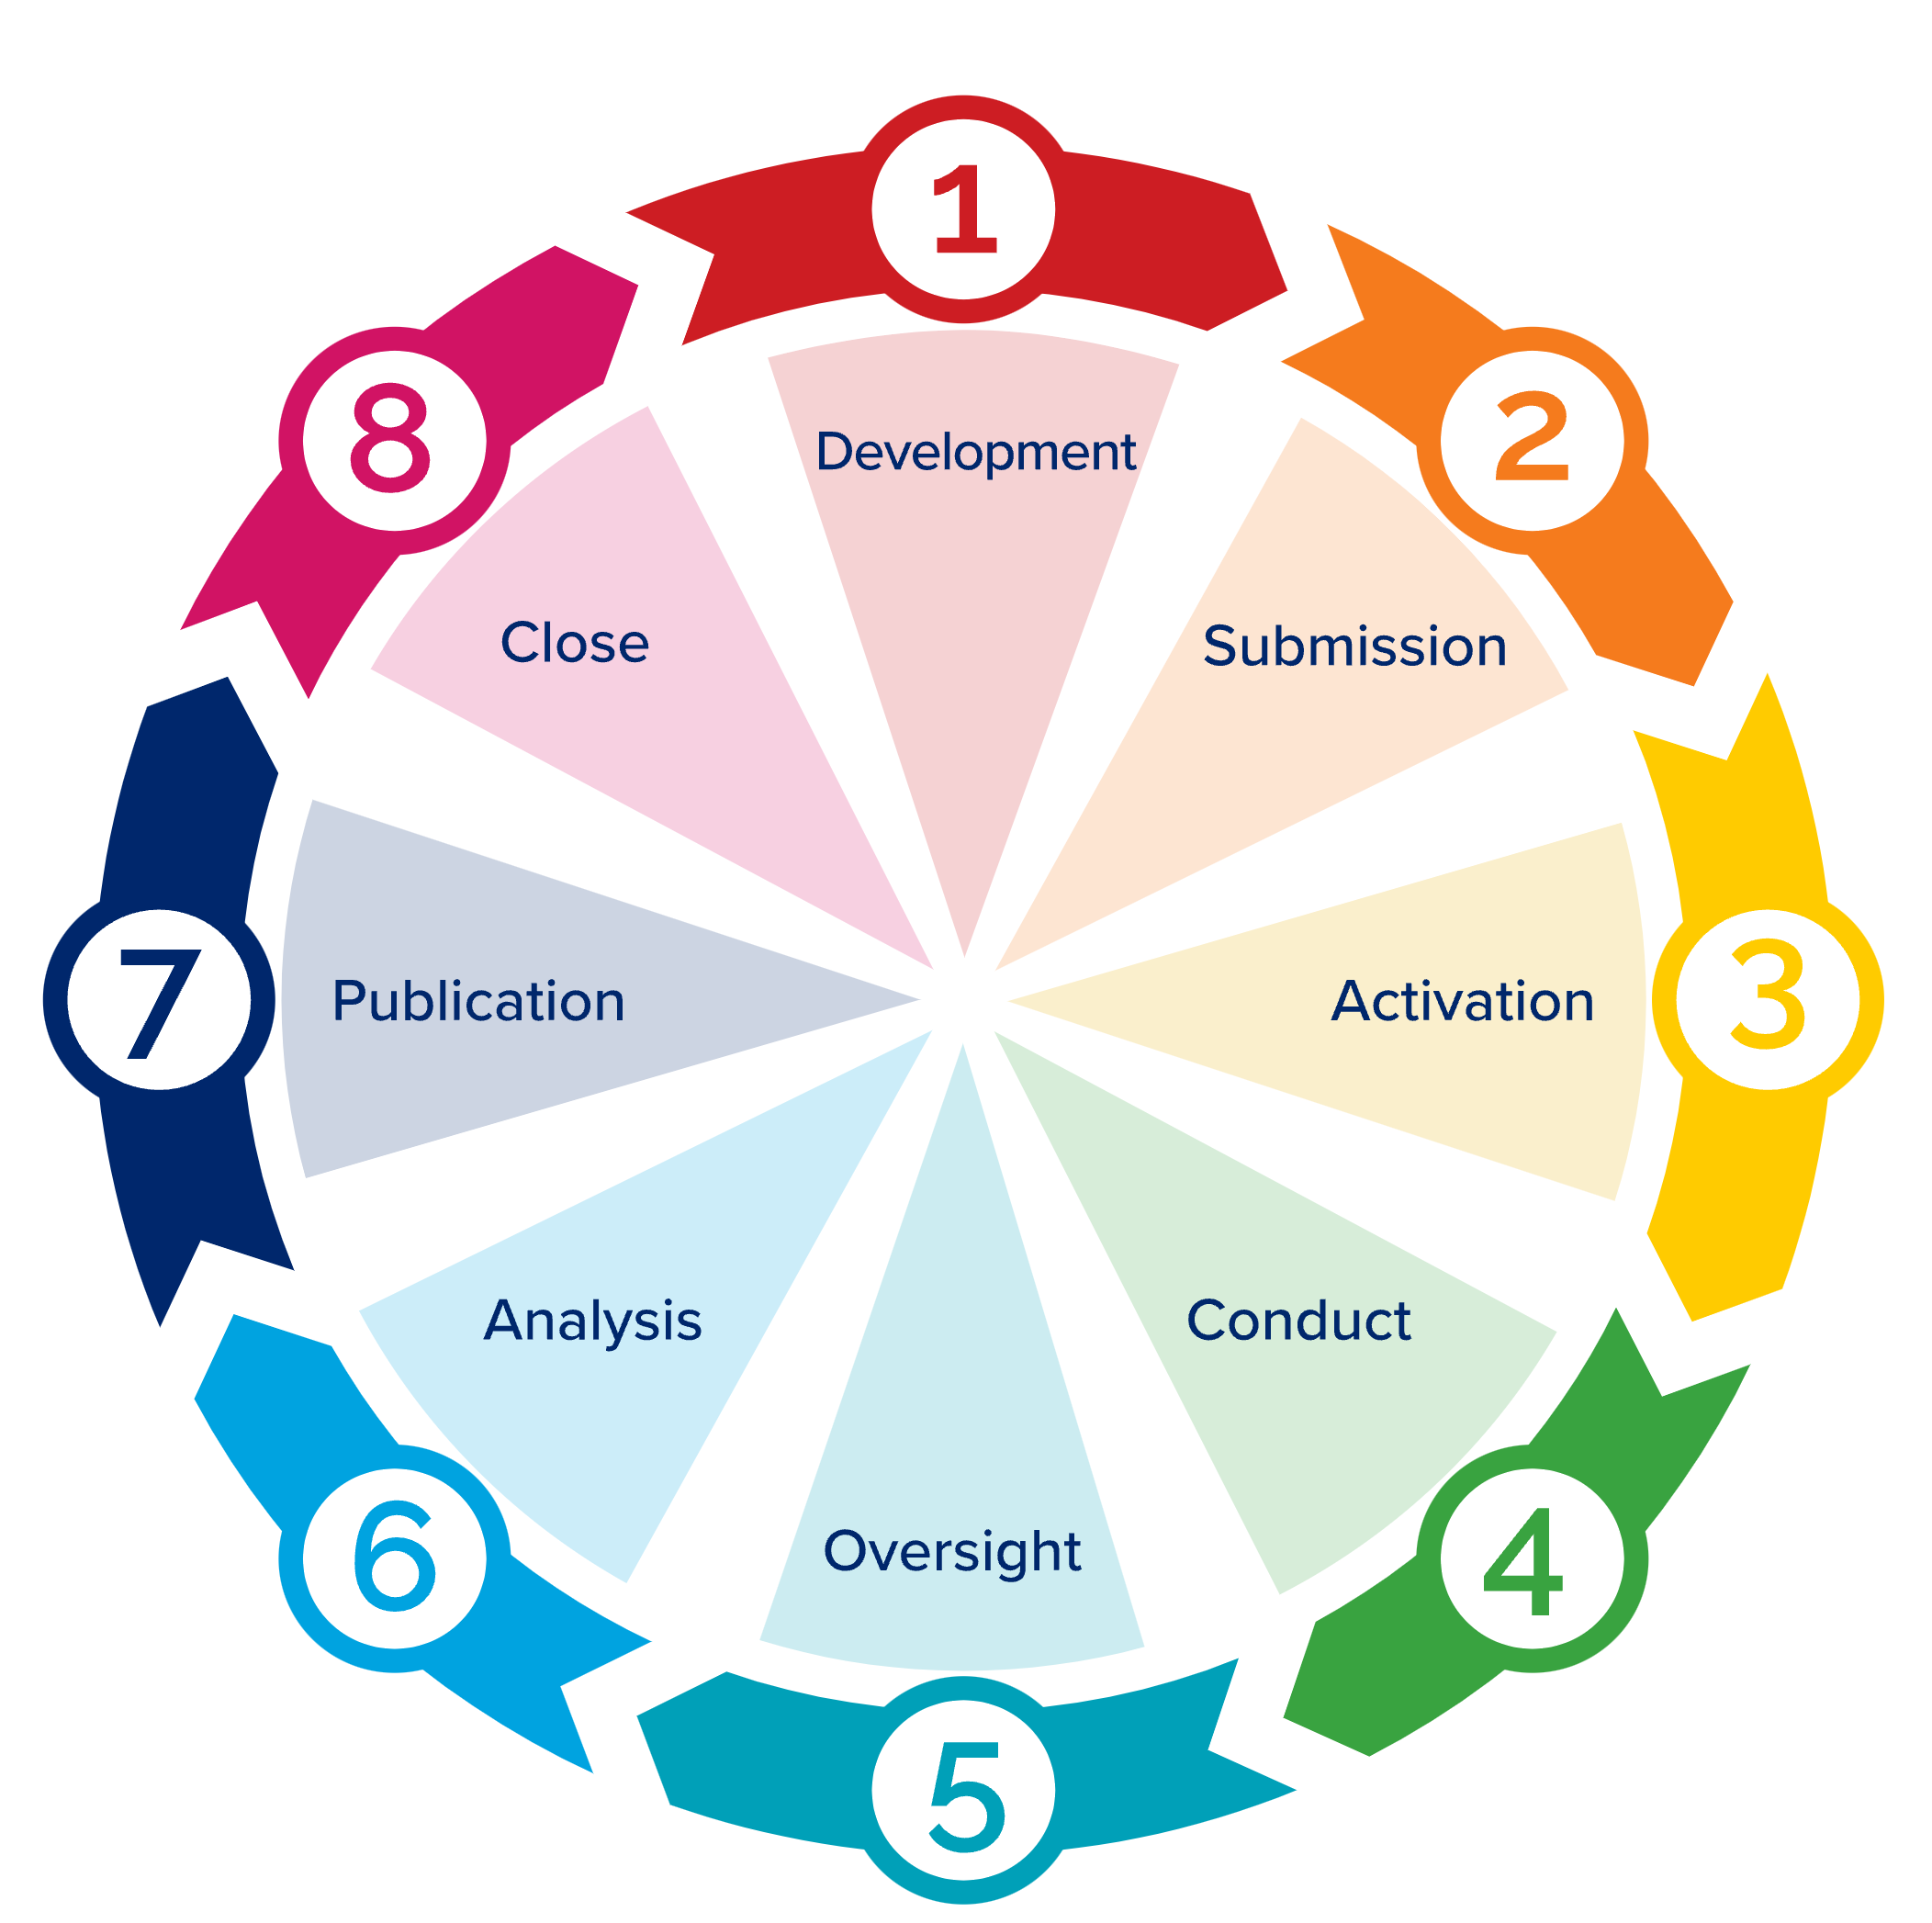
Part of articulating an answerable research question is tackling an analysis as a project, which means following good research-project management practices. The general project management phases defined by the Project Management Institute (project initiation, planning, execution, monitoring, closure) are shown in Figure 9.5. In N3C terms:
- Development refers to Protocol Design,
- Submission is obtaining a Data User Request (DUR)1,
- Activation is assembling and running the research team,
- Conduct is the workflow described in Chapter Analyzing the Data,
- Oversight is the responsibility of the project PI,
- Analysis is further workflow, and
- Publication is both formal (manuscript submission) and otherwise (preprints, conferences).
The term “protocol” is used in many ways in science. Basic scientists use it for how a particular laboratory reagent should be used, processed, or implemented. In human subjects research, it is the commitment of the researcher to how patients, and their data, will be managed in a study.
In Real World Data analysis, the meaning is a bit different. In the Protocol Pad:RWE Detailed Instructions , we write:
In human subjects research, the protocol is what turns data into evidence: By following rules of methodology, we claim that the data we collect can support conclusions broader than the data set itself. “Protocol” can also refer to a specific set of steps that lead to reproducible results.
Data-only research, like that in N3C, is different from prospective research, because we must make allowances for incomplete data, for selection bias, for access bias, for poor recording, for late recording, for differences in clinical practice across sites, for differences in documentation practice across sites… In other words, there are many issues with the data, before one gets to the analysis of scientific interest. This process of research is also called by Stoudt and colleagues, the “data analysis workflow” (2021).
N3C has developed a tool to facilitate the development of protocols known as the Protocol Pad:RWE . In the following sections we walk through recommended components of a protocol. Briefly, they are (a) Protocol Design, (b) Development, and (c) Completion:
9.2.1 Protocol Outline
Protocol Design ❶
- Articulate administrative information
- Articulate research question
- Specify protocol
- Describe Patient, Exposure/Intervention, Comparator, Outcome, Time (PECOT) elements in text
Protocol Development ❷
- Manage the protocol development process
- Define PECOT elements as objects and data sets
- Assess data quality
- Articulate missing data plan
- Perform initial analysis
- Incorporate fairness and debiasing
- Iterate
- Commit to final run
- Perform sensitivity analysis
Protocol Completion ❸
Several groups in N3C focus on the quality of the research process, in general, and analytics, in particular. The Data and Logic Liaisons provide general tools and approaches to making data available to research teams and demonstrate good models for organizing research teams. The Applicable Data Methods and Standards (ADMS) domain team provides a forum for discussion of cross-cutting analytic concerns. The Machine Learning and Pharmacoepidemiology domain teams, besides working on specific projects, have generated protocols that can serve as models for analysis. Good Algorithmic Practice (GAP) Core Team; and various subject-matter domain teams.
9.3 Protocol Design ❶
The Design is where the intention and information about the protocol are placed. A protocol design may be generated iteratively, as details are better honed and even the intention becomes clearer. By the point that the finally-established protocol is executed, the design should be fixed. At the very least, if substantive design modifications are to be implemented in research that is not strictly exploratory, we suggest documenting the reason for doing so.
9.3.1 Articulate Administrative Information
9.3.1.1 Objective
Gathering administrative information, such as DUR number, team members, and research question ensures that all the necessary elements are established to successfully execute a publishable research project with a clear objective.
9.3.1.2 Approach
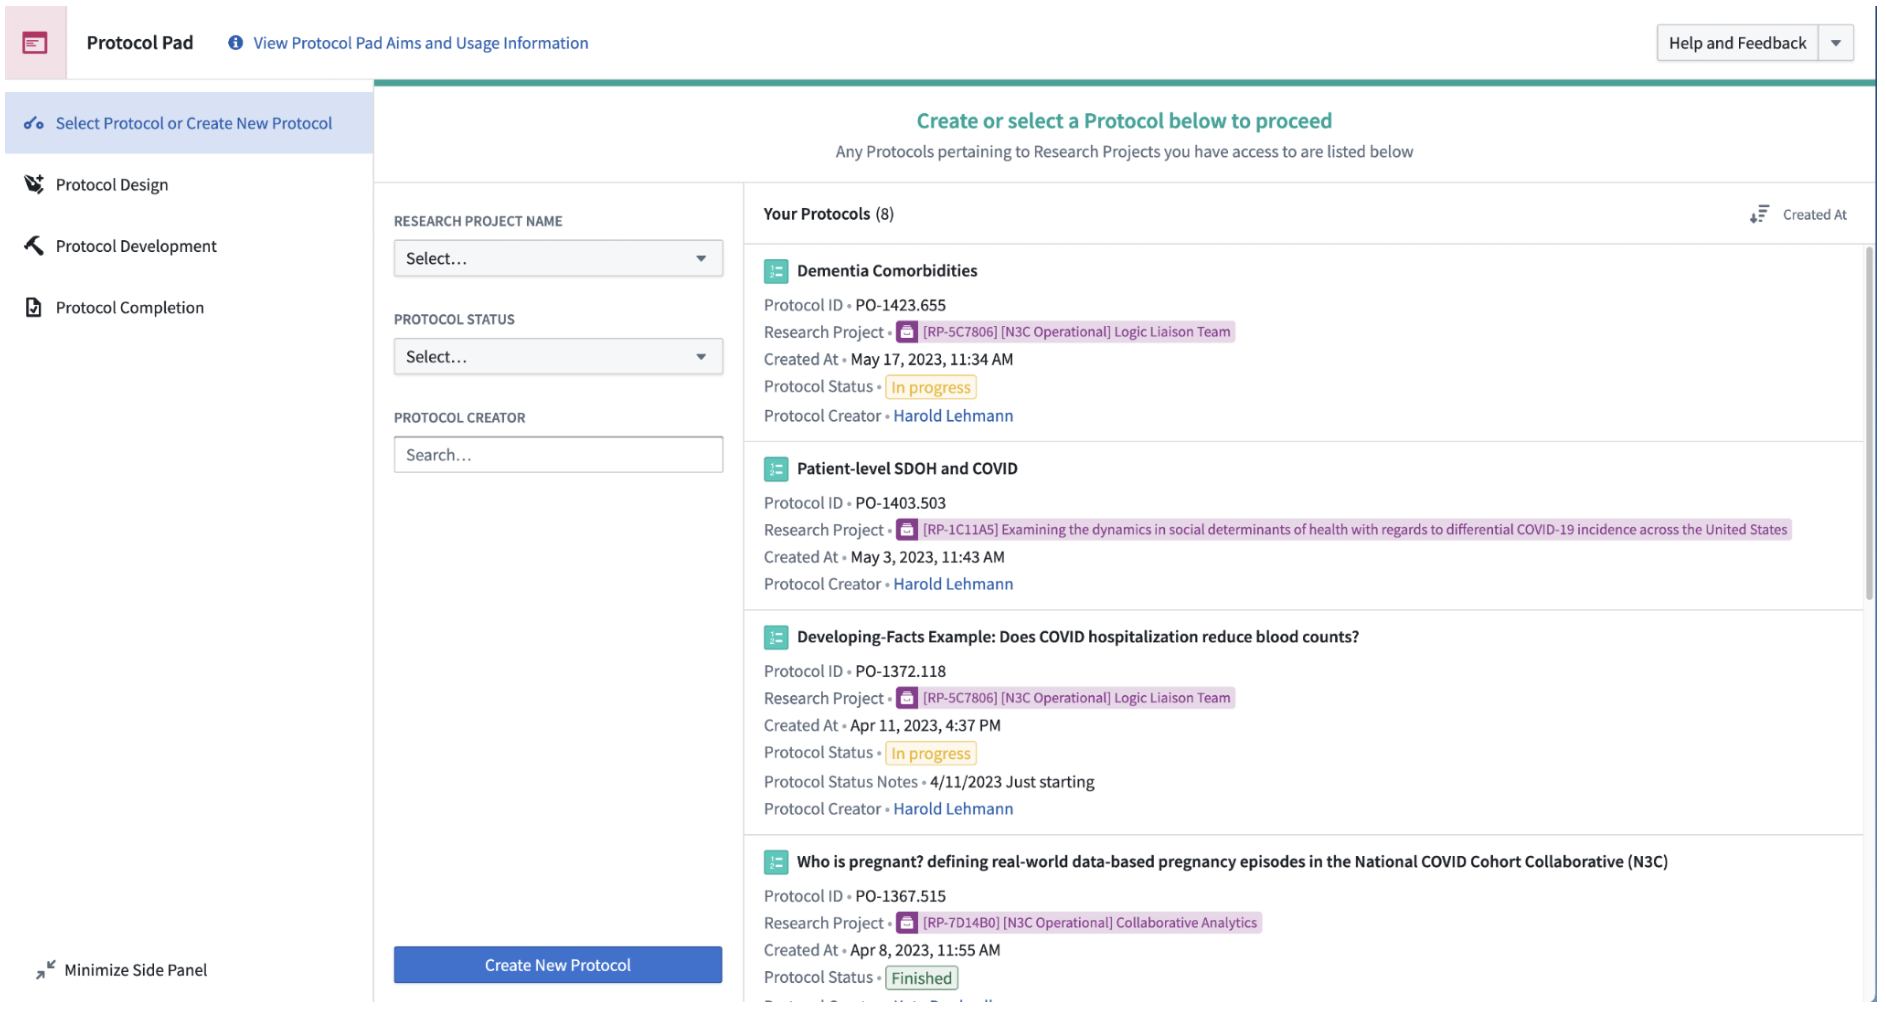
Several tools provide checklists a researcher can follow to ensure their work will be publishable. The previously mentioned Protocol Pad:RWE, for example, guides researchers through protocol development, and is integrated with other N3C tooling to capture relationships to teams, researchers, and artifacts such as concept sets, analyses, and datasets. STaRT-RWE (Wang et al., 2021) provides a more expansive methodological checklist. Table 9.1 below lists the elements and sub-elements in the checklist, along with suggestions for where in the Enclave the information may be found. The RWE Protocol Browser shows completed protocol Overviews of some available protocols.
| Element | Sub Element | Source in the Enclave |
|---|---|---|
| Protocol Title | Manually entered | |
| Objective Primary | Manually entered | |
| Objective Secondary | Manually entered | |
| Protocol registration |
|
Supplied by Protocol Pad:RWE |
| Protocol version |
|
Supplied by Protocol Pad:RWE |
| Funding |
|
Manually entered |
| Data Use Agreement (DUA) |
|
Supplied by Protocol Pad:RWE |
| Human Subjects/ Ethics Approval |
|
Assumed by DUR |
Not everything you need to start, though, is included in this list. Here are a few additional things to consider:
Assemble a team. A lesson learned and relearned is that any analysis in an environment like N3C requires interdisciplinary teamwork. Clinicians provide the all-important reality testing and substance of the research questions. Biostatisticians articulate the analytic design and sometimes novel data required for those analyses (e.g., negative controls) that clinicians might not think about. Data scientists and others work to understand how the data are modeled to best extract and format the data, communicating potential pitfalls to the rest of the team. Other common roles include leadership and project management – see Chapter 5 for a more thorough review of team science.
Documentation/Lab Notebook. A “lab notebook” is an important part of any researchers’ repertoire, as a place to document thoughts, experiments, and results. The protected nature of N3C data complicates documentation, however: some study details need to be available outside of the Enclave for others to view, while others must stay in the Enclave (see Chapter 10 for details on what may be exported from the Enclave and how). This duality can lead to challenges in documentation and collaboration. Protocol Pad:RWE is designed as an environment to map out the intended analysis (see OHDSI) and to document the analysis and resulting artifacts that were actually created. Whether ProtocolPad is used or not, each analyst should maintain a lab notebook.
Project organization. Before sitting down to code, core items and roles should be articulated. These include the research question (even if only “descriptive”), the hypotheses (if any), the identification level of data required, the PI, and, as much as possible, the identity of those filling roles of domain expert, informatician/data scientist, and statistician, even if individuals are filling multiple roles. Methodology checklists help organize this information.
Code organization/formatting. Code Workbooks and Code Repositories are the heart of most N3C analyses and we recommend that researchers attentively format their code and documentation, like any modern software project. While these tools provide unique interfaces initially unfamiliar to most, they provide a host of features for organizing code, data, documentation, and metadata. See Chapter 8 for more details.
Which tools are best for what. The Knowledge Store, in particular, provides some analytic tools for use. Because of security concerns, not all code is sharable. Data partner IDs and patient IDs present in such code in one’s project should not be shared across projects or Data Use Requests (DURs), meaning that even programming code must be de-identified and templatized before being released to the Knowledge Store for general use or posted to repositories like GitHub for external review. Chapter 10 describes processes and requirements for safe sharing of both results and code.
Takeaway. Ideally, a project should have someone fulfilling the role of project manager, who ensures good documentation, keeps the project on track, and convenes meetings as needed.
Researchers should consider, ahead of time, documenting necessary project management information and assembling a team with the relevant expertise to maximize the likelihood of project success. Provided above, is a list of recommended information that should be documented, and additional organizational resources.
9.3.2 Articulate Research Question
9.3.2.1 Objective
Ensure that the question being addressed is explicit.
9.3.2.2 Research Questions you cannot answer in N3C
The research question is a natural-language expression of what the protocol is about. Although prospective delineation of a hypothesis with a null and alternative options is both standard and recommended in research, the “research question” takes a different form, and should be expressed as the question someone in the domain, or affected by the domain, might ask.
It’s important to know what questions can and cannot be answered in the Enclave.
While the data are rich and the applications are broad, there are still questions that cannot be adequately answered in the Enclave. We list that caveat, along with others, below:
- Beware making estimates or predictions that rely on a random sample of “controls” (as those in N3C are matched to confirmed COVID-19 cases within data partner by age, sex, & race/ethnicity)
- The COVID phenotype data partners use to generate N3C data match patients using 2 controls:1 case based on age, sex, race, and ethnicity
- Therefore, age, sex, race, or ethnicity should never be features of a prediction model between COVID positive and COVID negative patients
- Because each COVID-19 case is matched with two others, data come in with ostensible controls for each COVID-19 case, no population-targeted inference (prevalence or incidence) can be made, even with Level 3 data.
- In general, estimation of rates (of, for example COVID-19 infection) should be avoided.
- Beware making estimates or predictions that rely on nationwide representative sampling (in order to generalize to the entire US population at risk for COVID-19)
- E.g., prevalence or incidence of COVID-19 in any geographic region
- Weighting analyses by zip-code-based populations might be possible, but beware. (See External Data Sets.)
- Eligibility criteria defined using patient ICU status, as ICU status cannot be resolved from the visit-level information available, notwithstanding the possibility that some sites repurposed non-ICUs to serve as ICUs during surges in COVID-19 patients. In some cases, however, additional ADT (Admission-Discharge-Transfer) data may be available.
- Questions regarding COVID negative vs. COVID positives and co-morbidities (or other covariates) that are associated with the factors used to bring data into the Enclave, (i.e., age, sex, race, and ethnicity).
Special considerations. There are other questions that may potentially be answerable in N3C, depending on whether the required considerations are compatible with the research question of interest.
- Outcomes involving overall mortality cannot be assessed using EHR data alone. Linkage with an external data source containing more complete mortality data is necessary. N3C contains ancillary patient-preserving record linkage (PPRL) mortality data which is fully linked for a subset of data partners, and requires a separate DUR to access. Claims data, such as CMS, can serve as an alternative source of mortality data within enrollment periods, but limits the study population to those with Medicare for whom CMS data are available. This may be undesirable as that population may not be representative of the study population of interest.
- Analyses of patients with Long COVID. The U09.9 diagnosis code for Long COVID was launched in late 2021; its use was not immediately adopted among all data partners in the enclave (Pfaff et al., 2023), and its rate of uptake across sites varied. Efforts have been expended to creatively identify patients in the Enclave who might have Long COVID but who lack a U09.9 diagnosis code, including computable phenotypes (Pfaff et al., 2023).
There are others, and we welcome suggestions to add to either list. Please contact the chapter authors or see How to Contribute.
9.3.3 Specify Protocol
9.3.3.1 Objective
Ensure your work is grounded in an initial “natural language” protocol that resonates with subject matter experts (e.g., clinicians, etc.) and stakeholders.
Gain early insights into how the natural language version of the protocol will be tethered to specific code and the existence of potential confounders. This is an early step in promoting replicable and clinically valuable work.
9.3.3.2 Approach
Stoudt and colleagues (2021) identify 3 phases of a data-only research protocol: Explore, Refine, and Produce. N3C provides many tools to support a protocol. By linking the resulting artifacts together, we aim to develop a self-documenting, computable protocol. We list here the basic steps in articulating – and specifying attributes of – a protocol, as part of the “Explore” step. (Note that the term “protocol” is used here in a more general way than in biology, for instance.) This step is focused on the initial “natural language” view of the protocol; the code-based view comes in the next section. While the checklists seek text descriptions, we recommend linking the text as soon as possible to objects and datasets used in the Enclave, tracking what resources you’ve used, being specific with your team members, and enabling Protocol Pad:RWE to collect attributions across those resources to populate your Publication Intent Form and your manuscript, at the appropriate time.
Before analyzing the data, create a Directed Acyclic Graph (DAG) of the research question that reflects the causal model. Tools like Daggity (Ankan et al., 2021) can
- identify threats to validity earlier,
- suggest appropriate controls, and
- identify biases simply from the structure of the model.
In addition, a causal model helps to identify sub-projects, making the overall analysis ultimately easier and doable. Do note, however, that “documentation”, the Extraction, Loading, and Transfer operations (ETL), and data-representation issues are often not represented in such models, although faults at each of those steps can contribute to (cause) data quality issues.
The following simple example shows the power of a DAG in drawing attention to a specific confounder.
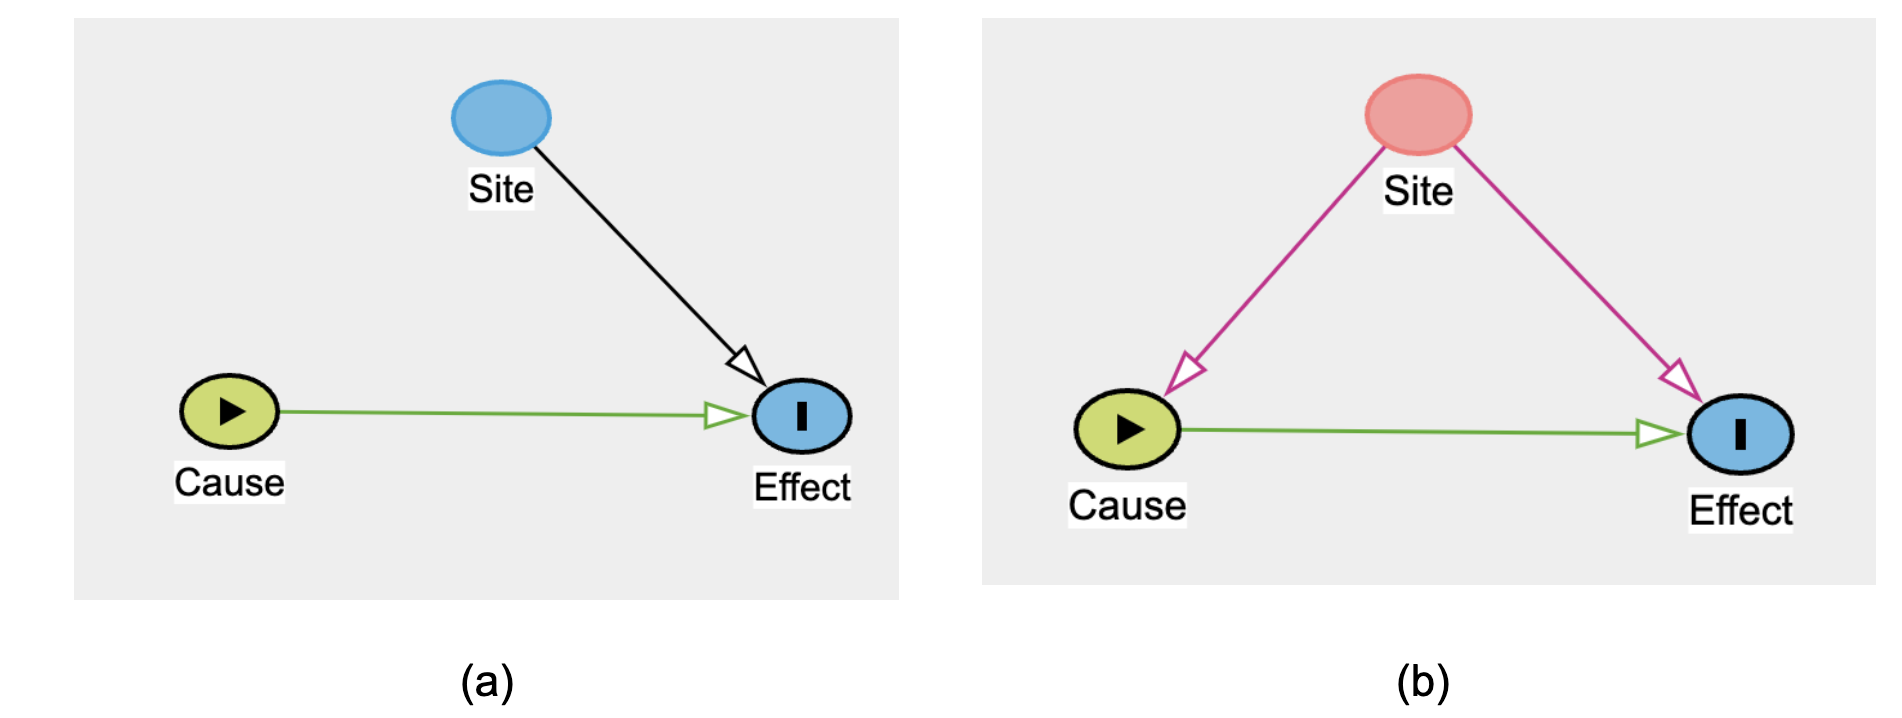
Figure 9.3 shows how data partner ID (i.e., “Site”) is always a confounder, in the sense of Figure 9.5, above. As such, stratification or some other strategy is always required first, on the way to deciding whether data can be pooled across sites. 2
9.3.4 Describe PECOT Elements in Text
9.3.4.1 Objective
Provide the core details for readers that define key elements of the study methodology.
9.3.4.2 Approach
Even in methodological studies, there is a universe of populations and contexts for which the methods apply (or not). In descriptive studies, the focus is on a population and its attributes.
In associational, causal, and intervention studies, the following attributes are important (Morgan et al., 2018):
- Population (cohort and control),
- Exposure/Intervention (if any),
- Comparator,
- Outcome,
- Time horizon, and
- potential confounders.
These should be articulated in text with proper intention so analysts and reviewers have a basis for assessing whether subsequent code matches the intention. (Of course, after confronting the data, these intentions often change prior to finalizing the protocol.)
Other attributes include: Design, Rationale, and study objectives, which need to be manually entered. The DUR identifier should be supplied by the system.
| Section | Element | Where found in the Enclave |
|---|---|---|
| TABLE 2. VERSION HISTORY |
|
|
| FIGURE 1. DESIGN DIAGRAM |
|
|
| A. Meta-data about data source and software |
|
|
| {For each data source:} |
|
|
As suggested in Table 9.2, it is helpful to diagram the cohort definition. A well-received model is that of Schneeweiss and colleagues (2019).
It is helpful to be precise in articulating the research question, so correct analytic methods will be chosen. Examples are differentiating classification from prediction from estimation, and association from temporal correlation from causal relationships.
9.4 Protocol Development ❷
9.4.1 Manage the Protocol Development Process
9.4.1.1 Objective
Support team science during refinement and production of a detailed protocol.
Provide an audit trail of how the protocol was developed.
Support execution of the protocol.
9.4.1.2 Approach
Team science, a transdisciplinary endeavor that entails both theory and application (Klein, 1996), has its own mix of needs in “data-only” (e.g., RWE) studies, and, in particular, in distributed settings. Communication is essential across distance in multicenter studies, as well as communication between and among disciplines. Regardless of the online tools, each team needs clarity on what the work is, why it is needed, and where it is heading. This clarity is especially needed around the protocol, because, while the Protocol Design specifies the outlines, Protocol Development fleshes out the details, which can change prior to protocol finalization, depending upon data availability and quality.
From a regulatory perspective, research must be auditable. Even if the research is not performed with regulatory intent, choices made and abandoned should be documented and available for review.
The remainder of this section lays out the elements of a data-only protocol.
9.4.2 Define PECOT elements as objects and data sets
9.4.2.1 Objective
Provide computable definitions for core protocol PECOT elements.
Instantiate those core protocol elements.
9.4.2.2 Approach
PECOT elements for analysis must be shaped from the raw data of the Enclave. The definition of a cohort is, in turn, based on key building blocks. Figure 9.5 shows the building blocks and their relationship to the typical notion of analytic variables in statistical models.
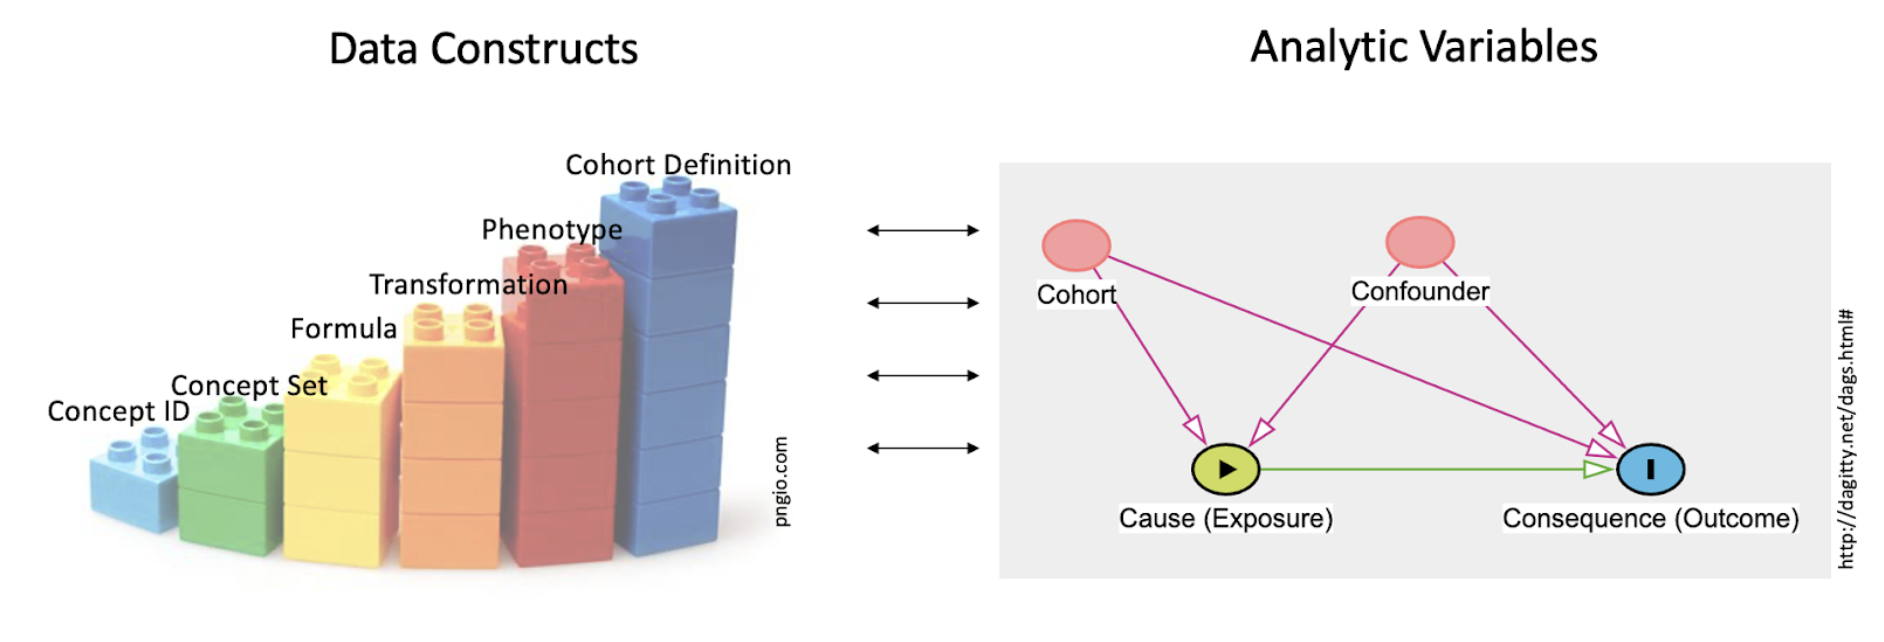
One key role of the data scientist is to create datasets from the raw material of the EHR (concept ids, and such) engineering variables, used by the analyst in the analysis, shown as toy building blocks on the left. Terms are defined in the text. This work of the data scientist is included in the set of tasks generally called data cleaning. The importance of data cleaning and appropriate preprocessing cannot be overestimated, and often requires clinical domain expertise in addition to sound data science practices, such as a well-reasoned approach to missing values (see Section 2.3) and normalization of values in the context of certain machine learning algorithms.
The simplest building block on the left of Figure 9.5 is the concept id, the raw data of the OMOP tables. Next comes the concept set, which creates sets of concept ids that are semantically synonymous for the purposes of this study’s Research Question. The next 4 columns all fall under the general category of derived variable; the different columns suggest different roles. So a Formula may be independent of the context of use (e.g., BMI ), regardless of the research question. A Transformation may be more complex, such as “macrovisit” (Sidky et al., 2023) to indicate a hospital admission, or “critical visit” , used in defining a COVID-19 hospitalization. A Phenotype defines a clinical construct (“COVID-19-positive” ; “visits with invasive respiratory support” , “HIV patient” ), while a Cohort Definition gives the phenotype a local habitation and a name (e.g., in the past 5 years) or utilizes an algorithm (e.g., Long COVID algorithm-based classification ).
The figure recognizes that the role each construct plays depends on the context; “diabetes” could be the target cohort (are patients with diabetes at higher risk of developing COVID-19 sequelae, compared with those who do not?), the confounder (does a presumed treatment for COVID-19 have its effect weakened in the presence of diabetes?), the cause (are there specific outcomes for patients with diabetes?), or the outcome (are any patients with COVID-19 at risk for developing type 2 diabetes?).
Iteration starts at the very outset of cohort definition. The double arrows in the center of Figure 9.5 refer to just this back-and-forth work analysts have in deciding when they have the right variable definitions.
The process of defining variables is laid out in Chapter 8. Many DURs involve a number of related protocols; the steps laid out in that chapter are directed at pre-processing that ultimately applies to a set of protocols. There are a variety of templates in the Knowledge Store that are produced by the Logic Liaisons and can facilitate this decision-making process. The Whitelist Filtering and Data Density by Site and Domain templates provide a method by which researchers can assess data quality and density prior to starting variable generation. Depending on the cohort of interest (COVID-19+ or All Patients) and/or outcome of interest, it may be desirable to eliminate particular sites based on their lack of sufficient data in the corresponding domain. There are also two additional Logic Liaison data quality templates that allow researchers to assess the quality of the variables they’ve created using the OMOP data tables. While the Systematic Missingness template provides an all-or-nothing indication of fact presence by site, the Fact Density by Site template calculates the Standardized Density, Median Absolute Deviation (MAD), and Directional Median Deviations (DMD) and creates heatmaps to visualize the metrics.
This back-and-forth work (“pre-processing”; “data cleaning”) points to the fact that developing the final protocol entails a series of decisions. Recognizing “data cleaning” as a decision-rich process helps to raise the profile of this work, helps the team to make those decisions explicitly, and helps to attract decision support to the process. These decisions should be documented in the lab notebook.
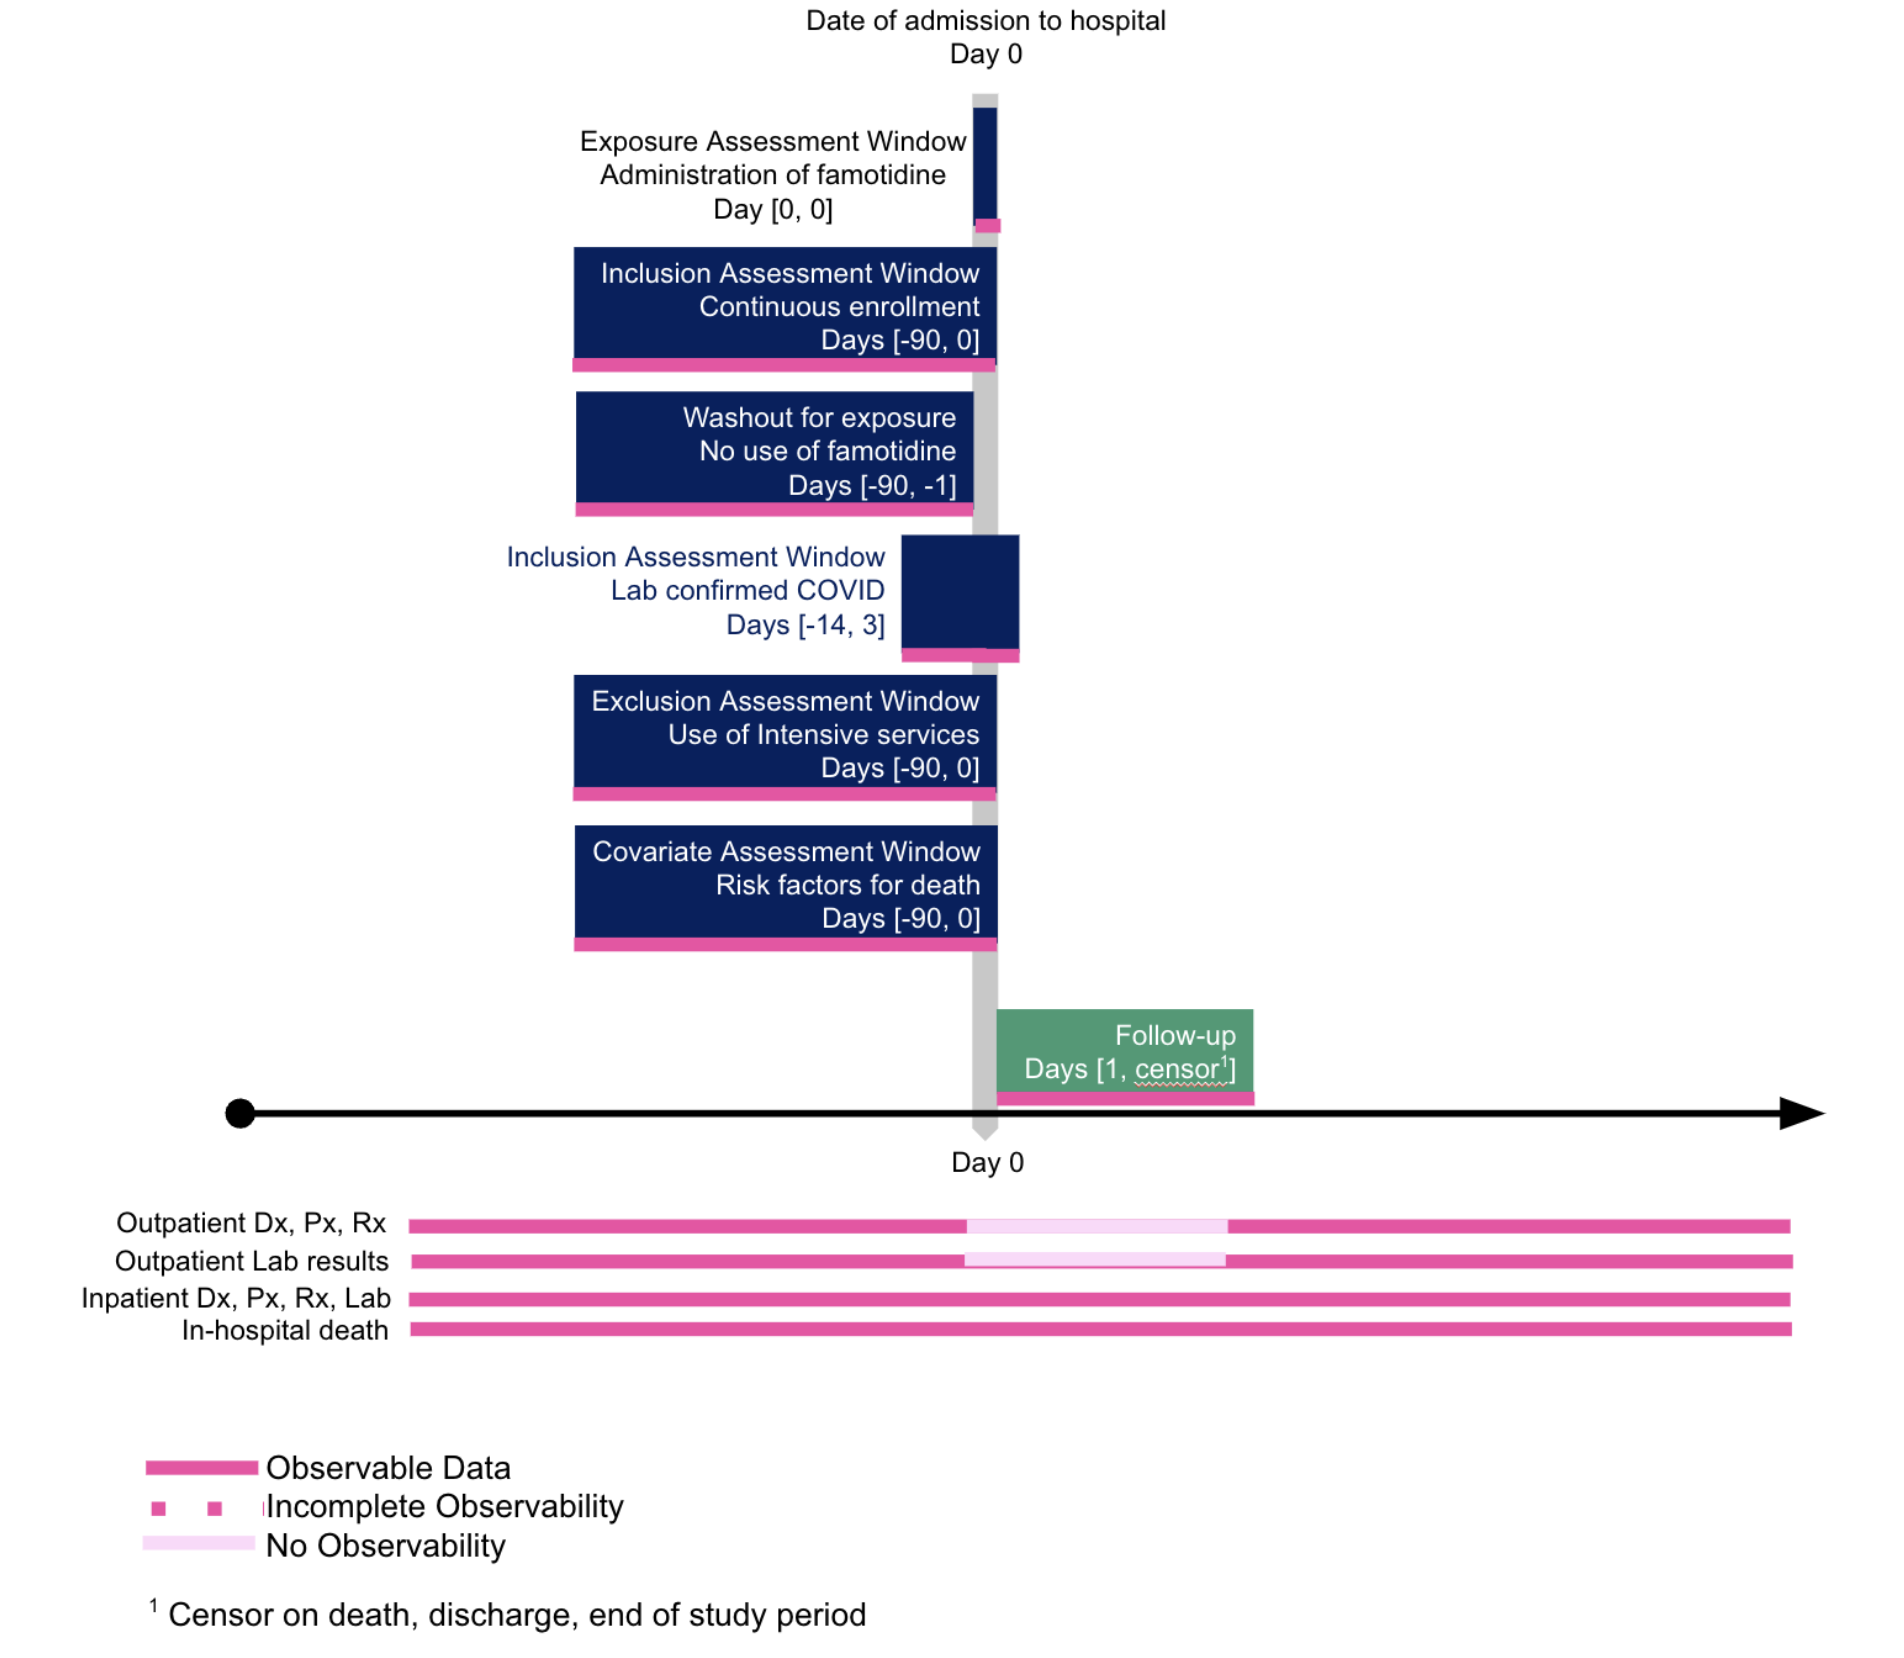
The elements of this phase that go into the STaRT-RWE checklist are listed in Table 9.3. The elements can be found in the Enclave in the (a) README in Template, (b) dataset description, or (c) Free text in Protocol Pad:RWE.
| PECOT | Element | |
|---|---|---|
| B. Index Date (day 0) defining criterion | Study population name(s) Day 0 Description Number of entries Type of entry Washout window Care Settings1 Code Type |
Diagnosis position2 Incident with respect to… Pre-specified Varied for sensitivity Source of algorithm |
| C. Inclusion Criteria | Criterion Details Order of application Assessment window Care Settings1 Code Type |
Diagnosis position2 Incident with respect to… Pre-specified Varied for sensitivity Source of algorithm |
| D. Exclusion Criteria | Criterion Details Order of application Assessment window Care Settings1 Code Type |
Diagnosis position2 Incident with respect to… Pre-specified Varied for sensitivity Source of algorithm |
| E. Predefined Covariates | Criterion Details Order of application Assessment window Care Settings1 Code Type |
Diagnosis position2 Incident with respect to… Pre-specified Varied for sensitivity Source of algorithm |
| F. Empirically Defined Covariates | Algorithm Type of variable Assessment window Care Settings1 Code Type |
Diagnosis position2 Incident with respect to… Pre-specified Varied for sensitivity Source/code of algorithm |
| G. Outcome | Outcome name Outcome measurement characteristics Primary outcome? Type of outcome Washout window Care Settings1 Code Category |
Diagnosis position2 Incident with respect to… Pre-specified Varied for sensitivity Source of algorithm |
| H. Follow up | Begins Date of Outcome Date of Death Date of Disenrollment |
Day X following index date End of study period End of exposure Date of add to/switch from exposure Other |
Chapter 8 discusses this process in more detail.
9.4.3 Assess Data Quality
9.4.3.1 Objective
Address data quality issues through action that mitigate the risk of reaching erroneous conclusions.
9.4.3.2 Data Quality Checks
A key component of the back-and-forth work is data quality checks. While the Data Quality Dashboard helps the Data Ingestion and Harmonization (DI&H) team decide on readiness of site data for release, data quality checks for a specific analysis is the responsibility of the analyst. While providing an exhaustive list of the steps to this process is outside the scope of this document, we highlight in Table 9.4 some data quality issues that warrant special attention. Many of the items in this list were borrowed from Sidky et al. (2023) which can be referred to for further detail.
*For non-COVID-based datasets, beware of how controls are brought into the Enclave.
| Data quality issue | Considerations and possible solutions |
|---|---|
| Site-specific variability in data availability |
|
| Site is always a confounder |
|
| Drug exposure data are often unreconciled |
|
| Lack of enrollment dates on patients |
|
| Limited availability of out-of-hospital mortality data |
|
| Previous medical history may be carried forward in EHR data |
|
| N3C COVID* “phenotype” is a 2:1 control:case match on COVID-19 negative and positive patients. |
|
9.4.4 Articulate missing-data plan
9.4.4.1 Objective
Prepare analysis to be generalizable despite missing data that ideally would be available.
9.4.4.2 Approach
There is a large literature on missing data. A strength of the centralized data of the Enclave is that one could assess whether missingness of a data item is a result of a “lesion” at the item (e.g., lab) level, visit level, patient level, or site level; see Figure 9.6. Before finalizing a protocol, search out what data are missing (starting with cohort definition, then outcomes, then confounders), at what level, and decide how to address them.
The pattern of missingness is critical. Data may be:
- missing not at random (MNAR): in which unrelated to factors that have been captured in the database,
- missing completely at random (MCAR): in which the missing and observed data have similar distributions, or
- missing at random (MAR): where there may be differences between missing and observed values, but these can be adequately explained by other captured variables.
Many techniques exist to deal with missing data (for example, restriction of analyses to complete data, which is acceptable in the context of data MCAR; imputation based on the average of observed values, etc.), but the suitableness of available choices depends on the pattern of missingness. Multiple imputation techniques based on machine learning, in which missing values are predicted based on other variables, may be appropriate if data are MAR.
Note that assuming data are missing completely at random may be a very dangerous assumption, especially in the context of observational or EHR data, where, for example, variability among practitioners in follow-up practices or disease surveillance may be substantial. If patients with the disease die, their data are missing. Imputation does not substitute for checking on mortality. While missingness patterns are difficult to verify with observational data alone, data across sites – as we have in the Enclave – helps in assessing whether data are missing at random or not.
9.4.5 Perform Initial Analysis
9.4.5.1 Objective
Perform the analysis efficiently, correctly, and reproducibly.
9.4.5.2 Approach
Analysis takes place in a specific Environment. The first phase is final data Pre-Processing, which overlaps with the previous steps but is more focused on the specific research question within the DUR. The analysis itself must take into account issues that make challenging the generation of real-world evidence from the real-world data of the Enclave. There are Recommended Methods for addressing those many issues. We also address the External Data Sets you might use to supplement the EHR and other patient-specific data in the Enclave.
9.4.5.3 Environment
Tuning the analytic environment is crucial to making the analysis as efficient as possible. Many analysts come into the Enclave unfamiliar with Apache Spark.
The key tools for analysts are Contour analyses, code workbooks and code repositories . Training is available for the Spark languages, PySpark and SparkR . Examples of code workbooks and Contour analyses can be found in the N3C Training Area . While the Enclave is a powerful environment, analysts have learned many “tricks of the trade” to do better work, such as dealing with slow builds . One issue is the preference for code repositories as more “native” to the Foundry (N3C environment) vs the benefits of code workbooks (which rely upon R or leverage data visualization steps, or DAG-viz of workflows) returning data.frames for R/Python3.
Caton, in his review of fairness in machine learning (ML), points to 3 phases of analysis: Pre-processing, Processing, and Post-processing. We defer other considerations for machine learning, including bias and generalizability, to the Machine Learning chapter.
9.4.5.4 Pre-Processing
Pre-processing is, essentially, the decision-oriented process described around Figure 9.5. While machine learners can manipulate a training set, protocols covered by this chapter do not have that right.
Instead, beyond the “cleaning of data”, analysts must be concerned with selection bias and collider bias (Griffith et al., 2020; Weiskopf et al., 2023). The latter is a causal-modeling concern that results from “selecting” patients whose records we have (as opposed to those whose information did not make it into our records).
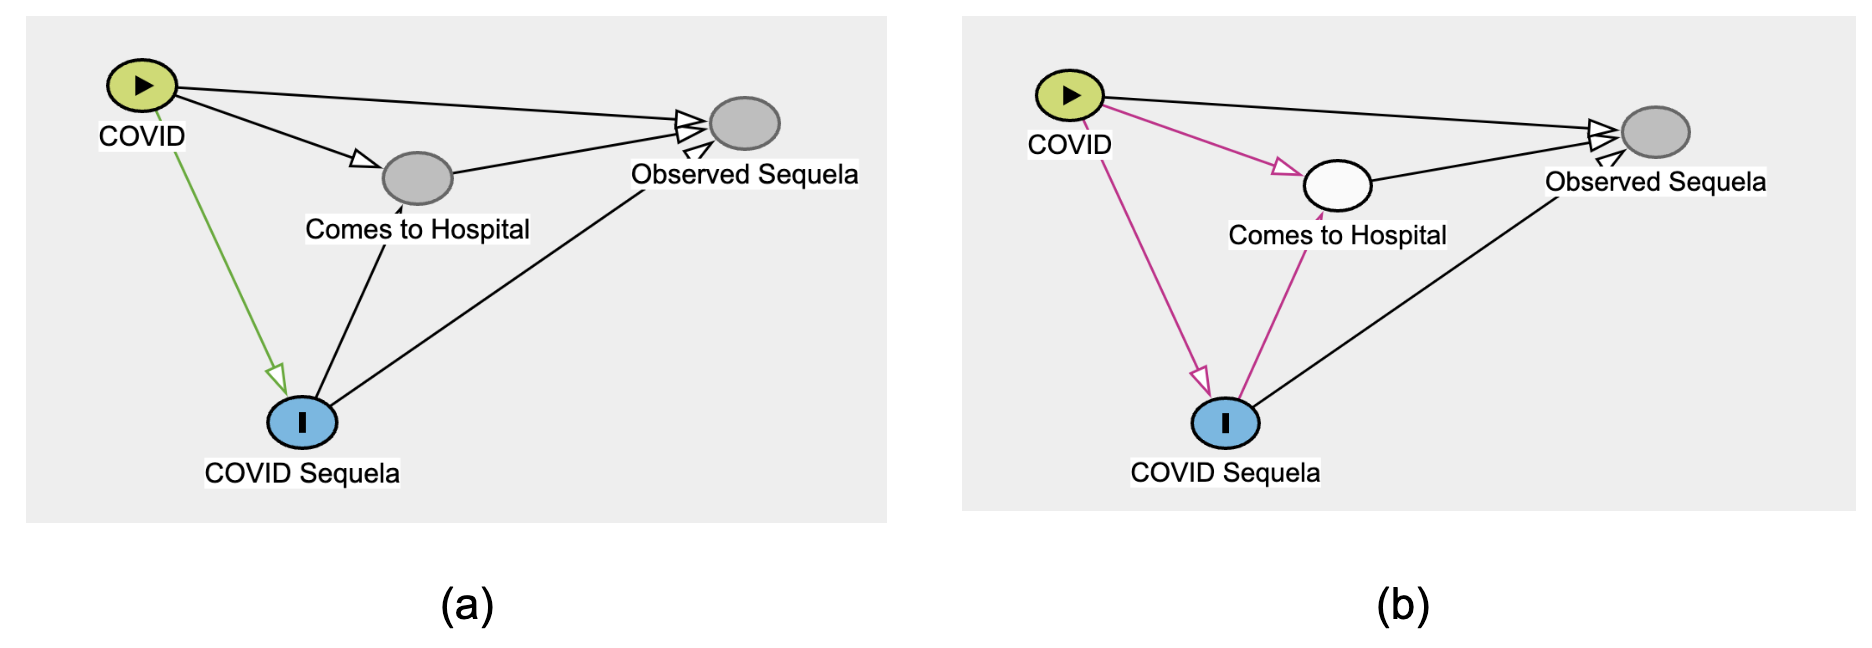
Figure 9.7 shows the potential for bias, just from limiting ourselves to (conditioning on) data in the EHR. The situation could be aggravated by social determinants of health (SDoH) factors that confound the relationship between COVID and its sequela, influencing whether the patient comes to the hospital at all.
Attempts by N3C analysts to address this selection bias include propensity score matching, inverse probability weighting, balanced weighting, and G-computation.
The STaRT-RWE recommendations for the analysis phase itself are fewer; there are two phases: the primary analysis and the sensitivity analysis.
| Element | Enclave Source |
|---|---|
|
Protocol PECO |
|
Code Workbook (SQL, python R) |
|
Citation, link to Code Workbook |
|
Citation, description, link to Code Workbook |
While STaRT-RWE places “missing data” in “Analysis Specifications”, the absence of data is a key concern in developing the “Final” protocol; it’s notable that what data are considered “missing” depends heavily on the question or analytic task at hand, yet given such domain-driven considerations, one can rely on overarching frameworks like Rubin’s Taxonomy (missing [not][completely] at random) or on a structural missingness rubric recently-proposed in the machine learning literature (Mitra et al., 2023).
In analyzing EHR data, data should be assumed missing not at random (MNAR), unless there is a good reason not to do so (Tan et al., 2023). At the least, the data should be explored for missingness , and variability of missingness across sites considered. Data imputation should be considered if there is a reason to believe that systematic missingness is independent of unknown extraneous factors not captured by the data and imputation can be safely predicated upon knowledge of other captured variables that fully or adequately explain missingness.
It is during this final “data cleaning” phase that data quality issues arise that were not surfaced during the data ingestion, harmonization, or general-templating upstream work. Analysts are encouraged to report “an Issue”, notifying the N3C team of these issues.
9.4.5.5 Recommended Methods for Data Analysis
Study designs: See Franklin and colleagues for suggestions (2021). The Book of OHDSI (2019) provides a chapter introducing methods validity and fitting of method to the research question.
For associational/causal research questions, to address hypotheses and confounding, the FDA recommends a set of analyses that go beyond the typical regression types, yet is framed targeting a specific estimand that makes all five (ICH-E9[R1]) attributes (U.S. Food and Drug Administration, 2023):
| Active Comparator Adjusting Bayesian Twin Regression Bias Causal Inference Confounding DAG/ADMG Depletion of Susceptible Difference in Difference Doubly Robust Methods Empirical Calibration G-Estimation High-dimensional Proxy Adjustment Identification Immortal Time |
Instrumental Variable Inverse Probability Latent Class Growth Modeling (LCGM) (Manski’s) Partial Identification Marginal Structure Models Negative Control Non-adherence Perturbation Variable Propensity Score Pseudo Treatment Regression Discontinuity Reverse Causation Targeted Maximum Likelihood Estimation Trend in Trend Trimming |
Many epidemiologically-minded analysts use the term “confounder” when only “covariate” is meant, a variable that is associated with the outcome. A causal “confounder” is one that is associated with the exposure as well. While not all EHR-based research is “causal”, many studies seek “associations”, “effect”, or “impact”, each of which requires attention to some of these methods or issues. Other strategies include the simulated/emulated clinical trial (Hernan & Robins, 2016; Kuehne et al., 2019; Sidky et al., 2023).
PCORI has a Methodology Standards list of its own that, unlike the reporting guidelines described below, goes into detail about analytic plans themselves. Standards of particular interest to analysts in N3C are Standards for Data Integrity and Rigorous Analyses, Preventing and Handling Missing Data, Heterogeneity of Treatment Effects (HTE), and Standards for Causal Inference Methods.
Unfortunately, to date, distressingly few studies based on EHR data report on missing data or sensitivity analysis, use these methods, or these reporting checklists (Li et al., 2023).
Several N3C studies have used propensity scores (matching or otherwise) to minimize selection bias and treatment-assignment bias in this observational dataset (Andersen et al., 2022; Narrett et al., 2023; Zhou et al., 2022).
9.4.5.6 External Data Sets
Over 50 external datasets are available for analysis via the Knowledge Store, such as:
- Mapping ZIP codes to states and geolocations ,
- American Communities Survey ,
- Social Deprivation Index ,
- Residential segregation indices , and
- Air quality .
These datasets help in linking patients to Area-level Social Determinants of Health (SDoH), in particular, and for debiasing results based on EHR data from academic health centers. Of course, applying geographically-based measures to an individual can lead to its own sorts of bias. See Chapter 7 for more information.
Ways to use the external sets include census data (Madlock-Brown et al., 2022a, 2022b) and a mix of spatial units available for linking (zip code, county) (Cutter et al., 2014). The distance between patient zip code and facility zip code is at times used as a proxy for rurality or difficulties in healthcare access.
Analysts re-using code from the Knowledge Store are encouraged to post comments on those Knowledge Store items to alert later analysts to the strengths and challenges of the specific code. Analysts are also encouraged to post a Community Note describing their strategy and approach, if that approach cannot be templatized in a Knowledge Store item.
9.4.6 Incorporate Fairness and Debiasing
Analysts have become more sensitive to the issues of methodological and social bias and fairness implicitly or explicitly reflected in the data and analyses performed. The Health Evidence Knowledge Accelerator (HEvKA) Project, as part of EBMonFHIR, is working on a list of over 200 methodological biases.
N3C has led a number of seminars on such biases. Caton and Haas (2020) provide a comprehensive list of measures, corresponding to different notions of equity; these include statistical parity, impact disparity (Islam et al., 2022), equality of opportunity, calibration, and counterfactual fairness. A key point is that, as Kleinberg and colleagues showed (2016), an analysis cannot satisfy all these notions simultaneously.
Methodological biases of specific concern involve time, such as Immortal time bias, (semi-)competing risks, and time-dependent confounding.
9.4.7 Iterate
As Stoudt points out, developing an observational-study protocol has elements of discovery, meaning, effectively, that the analyst iterates. The “earlier” in the protocol one goes, the more likely the entire protocol will change, hence, we try to iterate at one step (e.g., variable definition) before moving on to a next step.
It is crucial that the elements of the analysis are finalized before the “answer” is revealed (e.g., does the exposure in fact lead to a difference in outcome?). As such, documenting what the “final analysis” consists of is crucial for believability.
Thus, running the algorithm blinded to the outcome or with a subset of data or with some surrogate for the final analysis is crucial to make sure that, in optimizing the analysis, you are not (consciously or not) tailoring the analysis to a pre-desired outcome.
9.4.8 Commit to Final Run
Once the elements are finalized, there is the “final run”, which still requires diagnostics that should be documented, if not reported. The team should be clear that, when this run is initialized, variables will not be redesigned or errant data eliminated. If a new protocol is suggested by the results of this run, it should be initialized as its own, new protocol.
9.4.9 Perform Sensitivity Analysis
A responsibility of any analyst is the extent to which quantities important to the question at hand may or may not be available or measured among the data at hand. Unmeasured confounding is a lurking concern in all clinical research, yet is typically assumed (under the guidance of domain experts) to not be present to a degree that it impacts quantitative findings such that conclusions (e.g., “treatment reduces risk of outcome”) actually change. It should be noted, however, that this assumption is - by dint of involving unmeasured quantities/variables that are confounding a targeted association/effect - not verifiable from available data. Thus, there’s effectively a need to assess how sensitive conclusions are to unverifiable assumptions via sensitivity analysis; an assessment of how quantitative findings (and thus conclusions) differ under a range of plausible departures from the unverifiable assumptions (e.g., there exists an unmeasured confounding effect U that entails an impact of confounding of a degree deemed possible by a domain expert); the “plausibility” of this range is crucially dependent on domain-expert input, rather than any data-driven or data-derivable extent. We return to the broader topic of sensitivity analysis below.
Sensitivity analysis ideally takes place after the final analysis, so one does not redo the analysis, taking the insight from sensitivity analysis into account. However, any sensitivity to initial assumptions is crucial to report. Sensitivity analyses are used to assess the robustness of the conclusions to uncertainties in the input (Franklin et al., 2022). While, as in the STaRT-RWE checklist, the focus is on varying values of key parameters, in N3C research (and other multi-EHR-based studies), attention should be paid to varying cohort definitions, and to definitions of other key variables and other constituents of an analytic model. Enabling such repeated analyses means automating a long chain of computing steps, so this strategy requires planning and engineering.
| Element | Enclave Source |
|---|---|
| What is the parameter being varied? | Protocol Step, Code Workbook |
| Why? (What do you expect to learn?) | Protocol Step (Lab Notebook) |
| Strengths of the sensitivity analysis compared to the primary? | Lab Notebook |
| Weaknesses of the sensitivity analysis compared to the primary? | Lab Notebook |
9.5 Protocol Completion ❸
9.5.1 Gather Results; Publish
While Chapter 10 is devoted to the process of publishing, here we would like to address what should be published.
First, do record your conclusion in an appropriate place in your documentation, so the link between your research question and your answer is clear.
Second, do fill out the appropriate methodological checklist. Ideally, most of the information will already have been documented, either informally in your lab notebook or in the ProtocolPad for the project.
Third, do attend to the components of your work that should be published or shared. Any concept sets used in the analysis should be cited and published to Zenodo/GitHub, which means they should be properly annotated. Any programming code that was used should, if possible, be templatized for sharing in the Knowledge Store. If you used code from the Knowledge Store, be sure to link your project to that object and to leave comments in the Knowledge Store for later analysts. If you have worked out a process that would be helpful to others, even if it cannot be represented as shareable code, leave a Community Note about it.
Fourth, consider generating FHIR-based evidence resources, for external computer systems to ingest, or for other research projects in the Enclave to take advantage of (Alper, 2023).
As part of reporting on an analysis, be sure to identify the data release (number or date) on which the analysis was done and validated.
9.5.2 Fill Out Methodology Checklist
As mentioned earlier, researchers are encouraged to submit a methodology checklist, or reporting guideline, to the publisher. Such submission is (1) considered best practice, (2) requested by publishers, and (3) communicates that the author is aware of state-of-the-art practices in publication. Perhaps the best single repository of such checklists is the Equator Network.
Research in N3C falls under “Observational” research, so STROBE (Strengthening the Reporting of Observational Studies in Epidemiology) is the most generally appropriate (Elm et al., 2014). However, for EHR-based research, RECORD (REporting of studies Conducted using Observational Routinely-collected health Data) is appropriate (Benchimol et al., 2015). The most detailed is STaRT-RWE (Wang et al., 2021). Protocol Pad:RWE attempts to collect the information in the process of doing the research that you will need at the end, for publication.
(Predictive models, machine learning, and AI have their own checklists as well.)
Note that these are reporting checklists, and not research checklists. This entire chapter has been constructed to provide some guidance about performing the research itself.
9.5.3 Review Evidence Quality
The Book of OHDSI has a chapter on Evidence Quality. The core of the chapter is the following graphic.
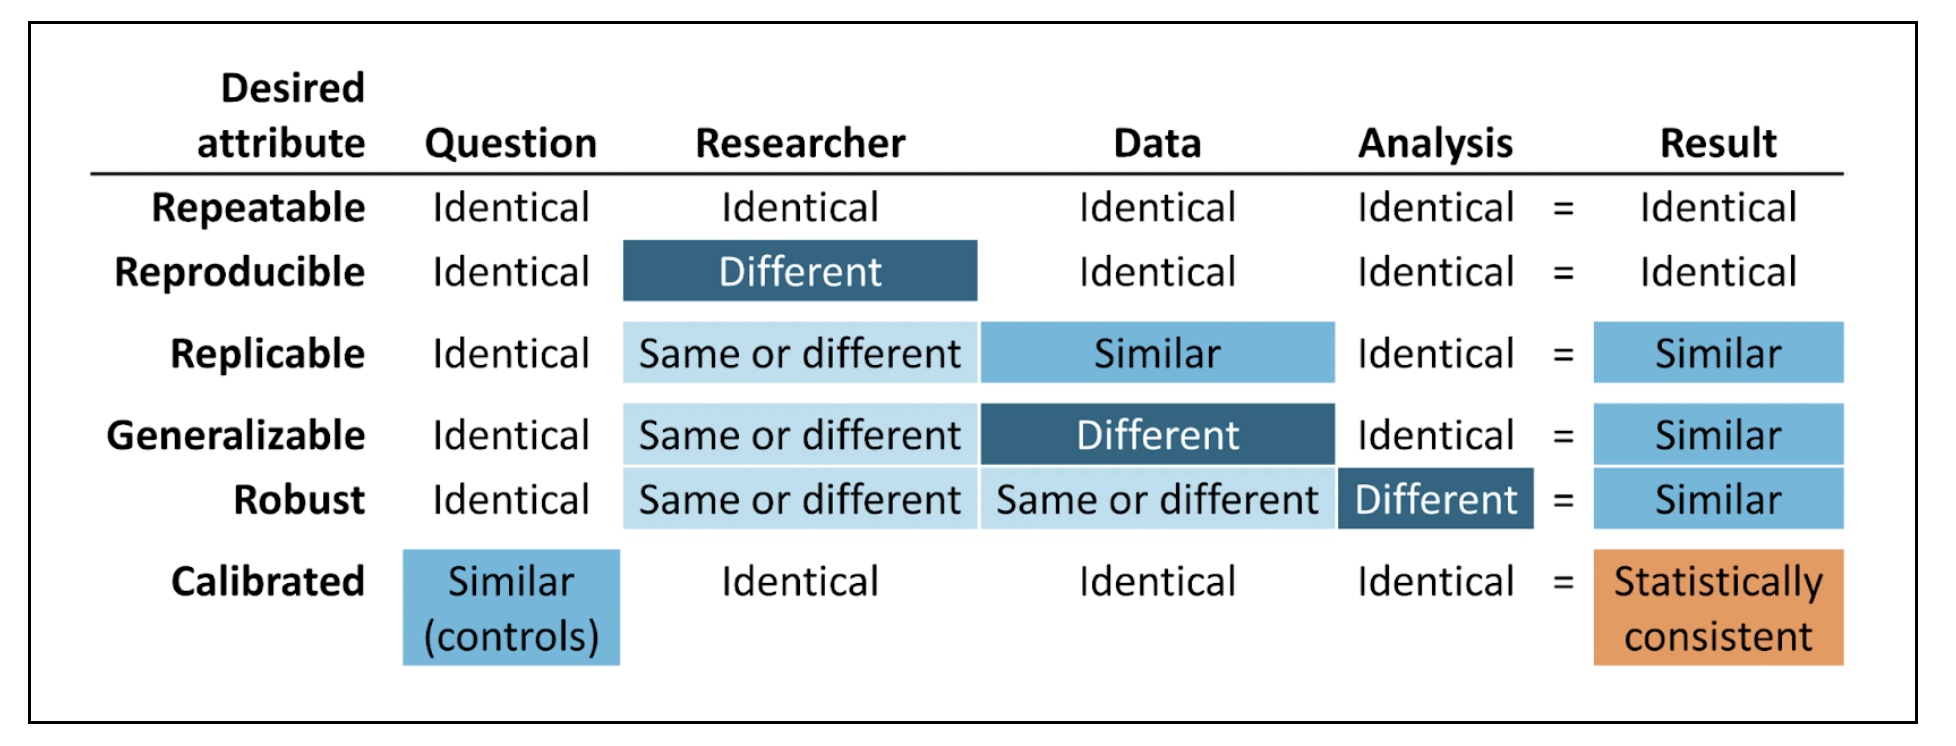
Suggestions for demonstrating these attributes in the Enclave are as follows:
Repeatable: Re-execute the Final Protocol. Focuses on the Code Workbooks.
Reproducible: Having another researcher execute the Protocol is difficult only because anyone working with a project’s data must be on that project’s DUR. This reproducibility entails a sort of code review, within the Project Team, however.
Replicable: Repeat the analysis with a later release of the Enclave data. Alternatively, perform the analyses on different subsets of data partners. This strategy is tricky, however, since the Final Protocol may have been developed, taking into account data peculiarities of specific sites.
Generalizable: This attribute relates to generalizability to unseen data, both temporally and geographically and could be implemented, as well, with a later release of Enclave data.
Re-use of templatized code, shared via the Knowledge Store, provides some generalizability. However, with the Knowledge Store, the focus is on methodological re-use, not validation of specific research conclusions.
Robust: Sensitivity analysis is the primary strategy to establish robustness, as discussed above. The Clinical Trials community (International Conference on Harmonization) are promoting the notion of “supplementary analysis”.
Calibrated: Applies to multiple-hypothesis analysis. A novel approach to observational data is the LEGEND (Schuemie et al., 2020) approach and the calibration of p values (Schuemie et al., 2018).
This chapter was first published July 2023. If you have suggested modifications or additions, please see How to Contribute on the book’s initial page.
Also see the Common roles and expectations section in Chapter 5.↩︎
See Redelmeier et al. (2023) for a more involved example of a DAG in COVID research.↩︎
See this N3C Community Note .↩︎